"Stop monster! Show us your spectrum!"
One must admit that spectra, the many-varied curves that plot the number of photons and their energy, appear to be rather uninspiring to the layman; nothing worse than a graph. But like one’s body temperature curve, they mean a lot.
For astronomers, spectra are like fingerprints from the stars and galaxies! The information they hold may be incomplete, like a tattered newspaper, but it tells a story. The images from a telescope are attractive, but spectra can reveal the innermost secrets of certain cosmic monsters.
The image of XMM-Newton’s deepest observation of the ‘blank’ X-ray sky in the direction of the Lockman Hole - where X-ray absorbing extra-galactic material is thinnest and one can best peek into the confines of the Universe - has already been acclaimed. It identifies about 150 new X-ray sources, most of them among the faintest hard X-ray sources ever observed.
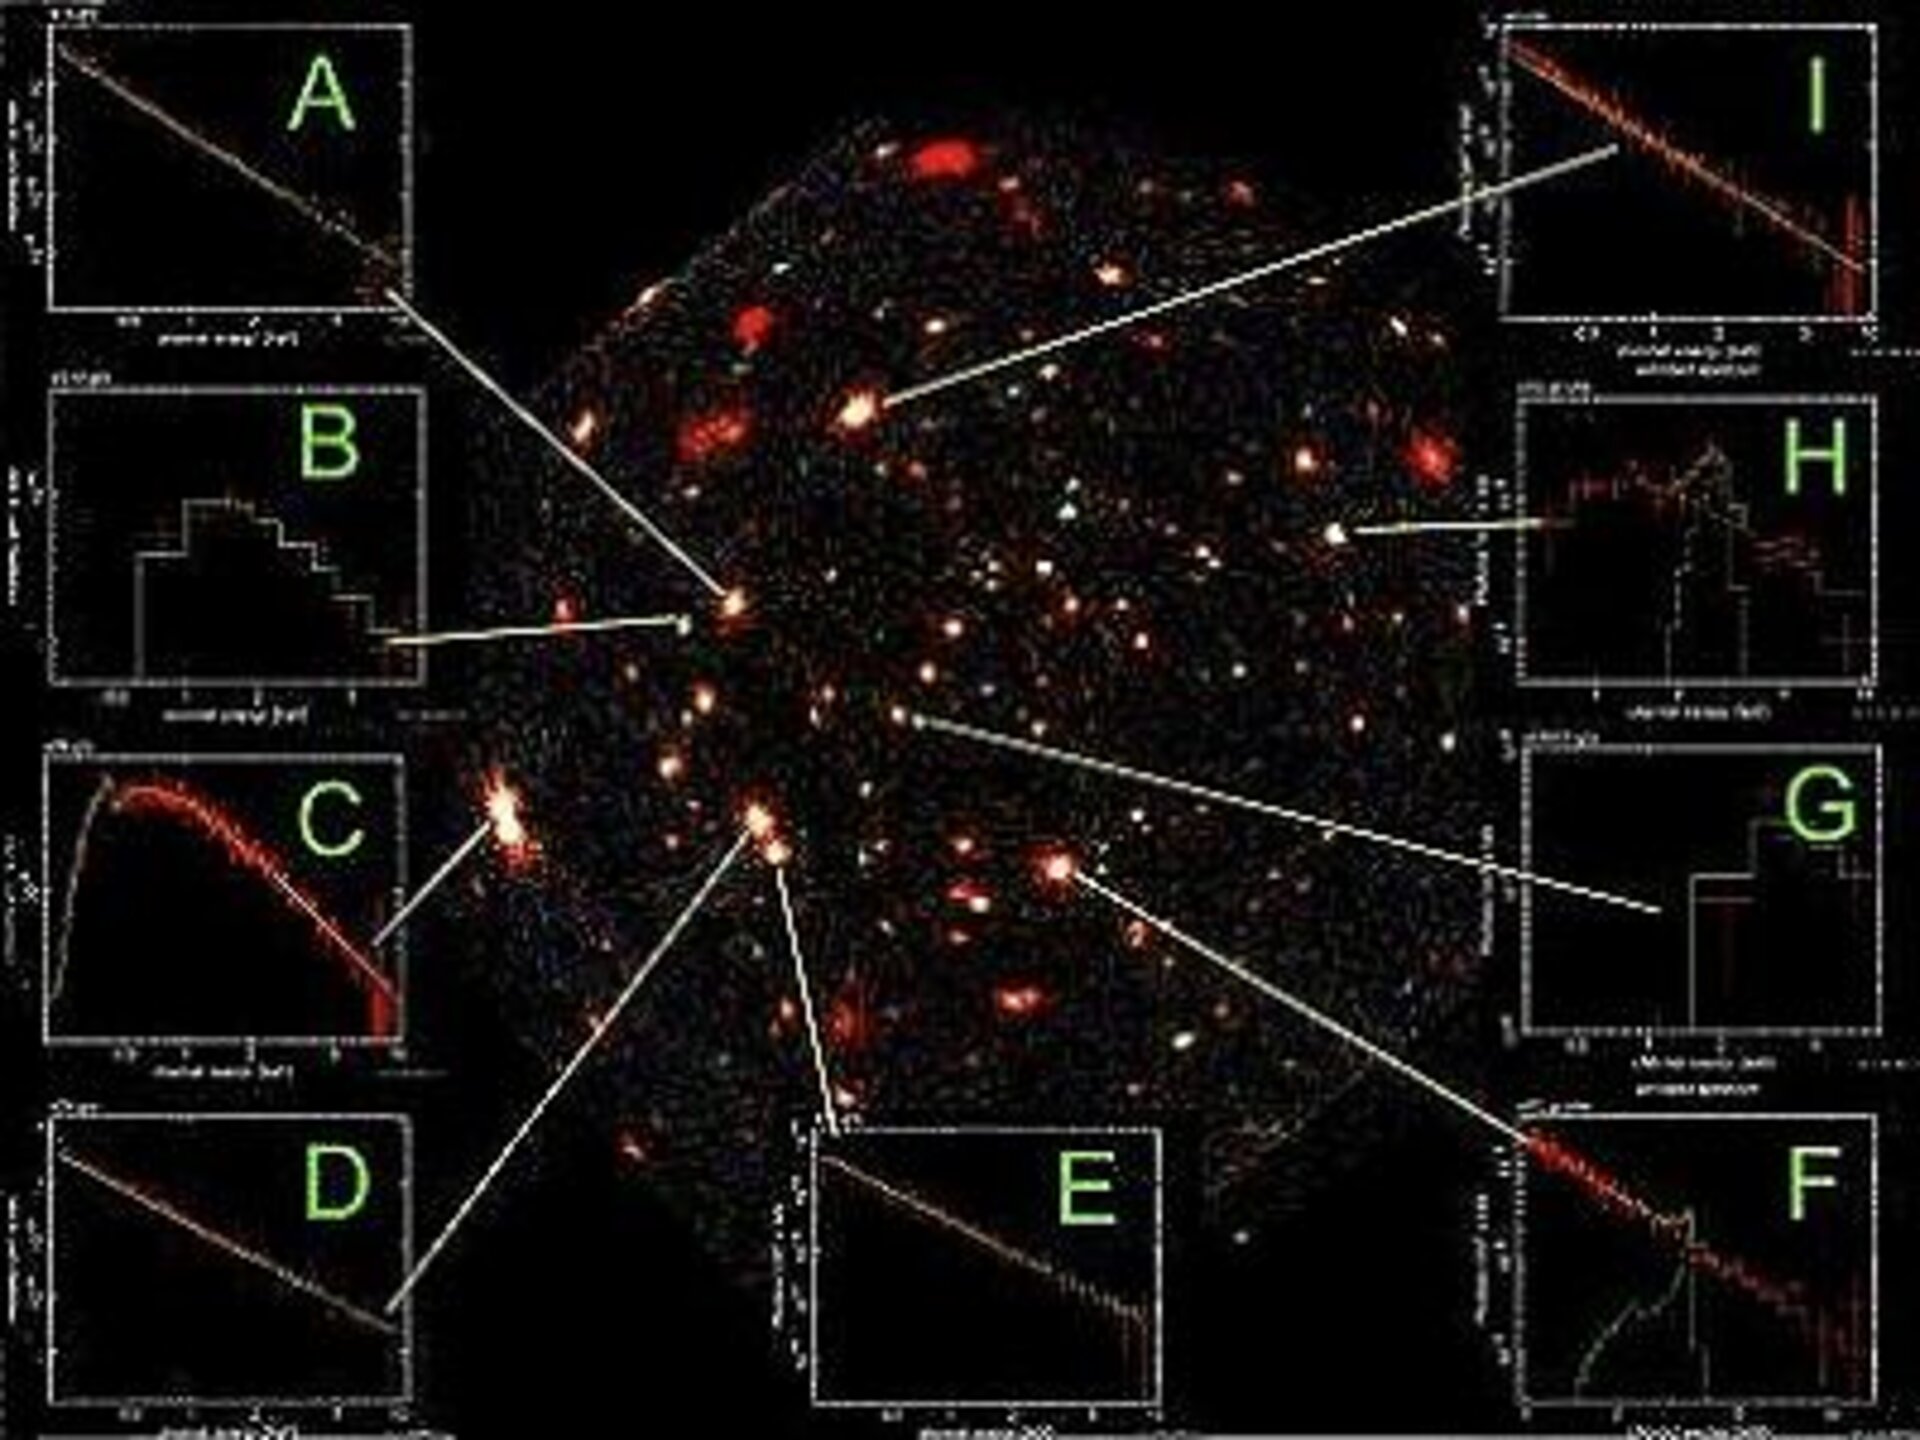
Many of the brighter X-ray sources in the Lockman Hole were previously identified with the ROSAT satellite. For these, XMM-Newton has now provided very detailed spectra, as is shown in a picture montage by Guenther Hasinger from the Astrophysikalisches Institut Potsdam - AIP.
The main image plots the soft X-ray photons, already observed by ROSAT, in red; green corresponds to intermediate X-ray photons, also detectable by NASA’s Chandra X-ray observatory; blue is used to show the hardest X-ray photons only detectable by XMM-Newton.
The individual spectra in the surrounding inserts 'rollout' this colour information into graphs, plotted in red, where the X-ray emission (the number of arriving photons) is plotted against the energy at which it is emitted. The green lines refer to model spectra fitted to these graphs.
Many of the sources are associated with black holes, monstrous gravitational wells into which matter is being sucked and in which even light disappears. Stellar-mass black holes arise after the death of a massive star which has used all its fuel. But there exist also supermassive black holes which are present in the center of almost every galaxy.
“The origin of these supermassive ones remains a complete mystery,” says Guenther Hasinger. “Forming these from many single black holes would probably take too much time. They might therefore be part of the original collapse of gas into a galaxy, in other words the seed objects of galaxy creation”.
The spectra of the X-ray emission from the sources can reveal a lot about the properties of the active nucleus. If low energy X-rays are sparse compared with those at higher energies, it indicates that there is much absorbing gas between us and the nucleus, and possible black hole.
The absorbing material may be in a ring or doughnut shape, surrounding the X-ray source. In some extreme cases, when we are looking at this accretion disk edge-on, the nucleus may be hidden from our view, and only the highest energy X-rays can escape.
Alternatively when there is little absorption, and the low energy X-rays are strong, the spectra display practically straight lines ('power-law spectra'). They indicate that we are getting a close to face-on view, looking right down into the nucleus and associated black hole.
Other sources show bumps or wiggles in their spectra. This can be attributed to the emission of iron atoms very close to the maelstrom of the black hole. From the shape of a bump, one can infer the geometry of the emitting region, for instance the distance from the hole and the angle at which we are observing the central accretion disk.
Clearly identified emission lines in the spectra are the fingerprints of different elements that are swirling around, very close to the ‘event horizon’ where matter finally disappears. From the displacement of these lines from their normal position in a spectrum, one can measure the velocities, close to the speed of light, at which these atoms are moving, and this indicates how fast the black hole itself is rotating. An iron line also tells us how close the accretion disk is reaching to the very edge of the black hole.
“All but one of these nine sources had already been identified by ROSAT. Whether they are unobscured sources with straight power law profiles, or objects whose X-rays are partially absorbed, the XMM-Newton spectra confirm the models, the way we had imagined we would see these sources in greater detail,” explains Guenther Hasinger.
“But the bright source, practically in the centre of the image is one of XMM-Newton’s new discoveries! We have given it the number 24021. Its nature is still unclear: it has a very different spectrum, practically no X-rays below the 2 keV energy level and a power law profile above 2 keV. We haven’t determined its redshift (how far away it is) and to know more we will need to observe this source with the new generation of 8-10m telescopes.”
Those who say spectra are dull must be lacking in imagination. The spectral fingerprints like those shown here today are revealing how black holes form and grow. If the Lockman Hole observation is an example, XMM-Newton’s spectrometric mission promises to be extremely rewarding.
Our thanks and acknowledgements to Guenther Hasinger (Astrophysikalisches Institut Potsdam - AIP)
More spectrum images can be found in the original article on the ESA Science website