ERS-2 data used in El Niño animation
A vivid animation based on data from ESA’s ERS-2 satellite shows the onset of the recent El Niño phenomena from July to December of last year.
Covering a large area of the Pacific Ocean from South America to Australia and southeast Asia, the animation demonstrates the three most important factors that mark a phenomenon that can shape weather patterns from South America to Australia, and from India to southeast Asia:
- sea surface temperature
- sea surface levels
- winds
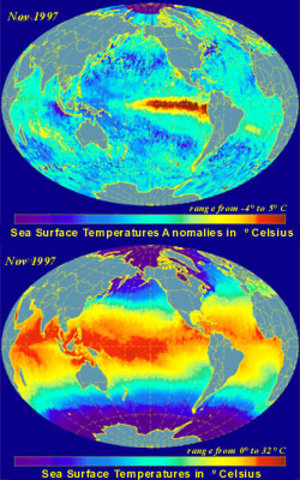
Surface water temperature is represented as deviations from average temperature values by the colour of the water surface. The greenish-blue colour represents the average temperature of the water. The purple colour represents a temperature 8 deg. Celsius above average, while the blue represents the other extreme of the scale, 8 deg. Celsius below average.

The height of the ocean water, as a deviation from average levels, is seen by the shape of the sea surface, an effect that is difficult to see because of the compression of the video. The 'wave' effect of the surface represents the amplified deviation of the water’s surface from its average height; the highest 'waves' display deviations from the average of about 1.8 metres.
The wind is shown as blue arrows. Trade winds in the area, blowing constantly from east to west, are clearly visible, particularly in the final months of 2002. Winds blowing in this direction, pushing warm surface water to the west, is consistent with a weak, or weakening, El Niño.
El Niño expected to weaken
According to the US National Weather Service’s Climate Prediction Center (CPC), El Niño conditions continued during January 2003, but there were indications that the warm episode is beginning to weaken.
"Consistent with current conditions and recent observed trends, most coupled model and statistical model forecasts indicate that El Niño conditions will continue to weaken through April 2003," the CPC forecast states. "Thereafter, the consensus forecast is for near-normal conditions during May-October 2003."
The animation incorporated data from several ERS-2 instruments. Sea level measurements were obtained by the radar altimeter, an active microwave sensor designed to measure return echoes from ocean and ice surfaces. ERS-2’s Along Track Scanning Radar (ATSR) acquired the data on temperatures of the sea surface temperatures. The European Centre for Medium-Range Weather Forecasts, an international organisation for weather data, provided the wind data used in the animation.
What causes El Niño?

In Spanish El Niño means 'the Christ Child' – a name given to it by the Peruvian fishermen who hundreds of years ago noticed how sometimes their coastal waters grew unusually warm and fish grew scarce around Christmas time. They had no way of knowing they were naming a vast weather pattern whose effects strike much of the globe.
El Niño is an irregular oscillation in tropical Pacific currents, around the Equator. Usually, the wind blows in a westerly direction in this region. This pushes the warmer surface water into the western Pacific (which can be as much as a half-meter higher than surface levels in the east). In the eastern Pacific, colder water from below the ocean’s surface is pulled up from below to replace the water pushed west. So, the normal situation is warm water (about 30 C) in the west, cold (about 22 C) in the east.
In an El Niño, the winds pushing that water to the west get weaker. With thermal circulation some of the warm water piled up in the west is released and moves back east, and not as much cold water gets pulled up from below. This makes the water in the eastern Pacific warmer, an El Niño trademark.
El Niño doesn't stop there. Warmer ocean waters weaken the winds, which in turn further warms the water, a cycle that makes El Niño even stronger. This can have wide-ranging consequences on climate patterns around the world. These can include vastly increased rainfall in South America, drought in Australia and fires across southeast Asia, dying coral reefs in India, severe winter storms in California, a heat wave in Canada and intense hurricanes raging along the Pacific Ocean.
This phenomenon seems to occur every three to seven years. The El Niño of 1997-98 is estimated to have caused more than €30 000 million of global property damage and an unknown toll in human lives.
Several versions available
Several high-resolution versions of the animation are available in Windows (.avi) and Quicktime (.mov) formats (please be patient while they load). To view the animation, click on the preferred version.
160x120 resolution -
Windows (2.8 mb)
QuickTime (3.6 mb)-
320x240 resolution -
Windows (9.6 mb)
QuickTime (9.5 mb)