Looking at the lands
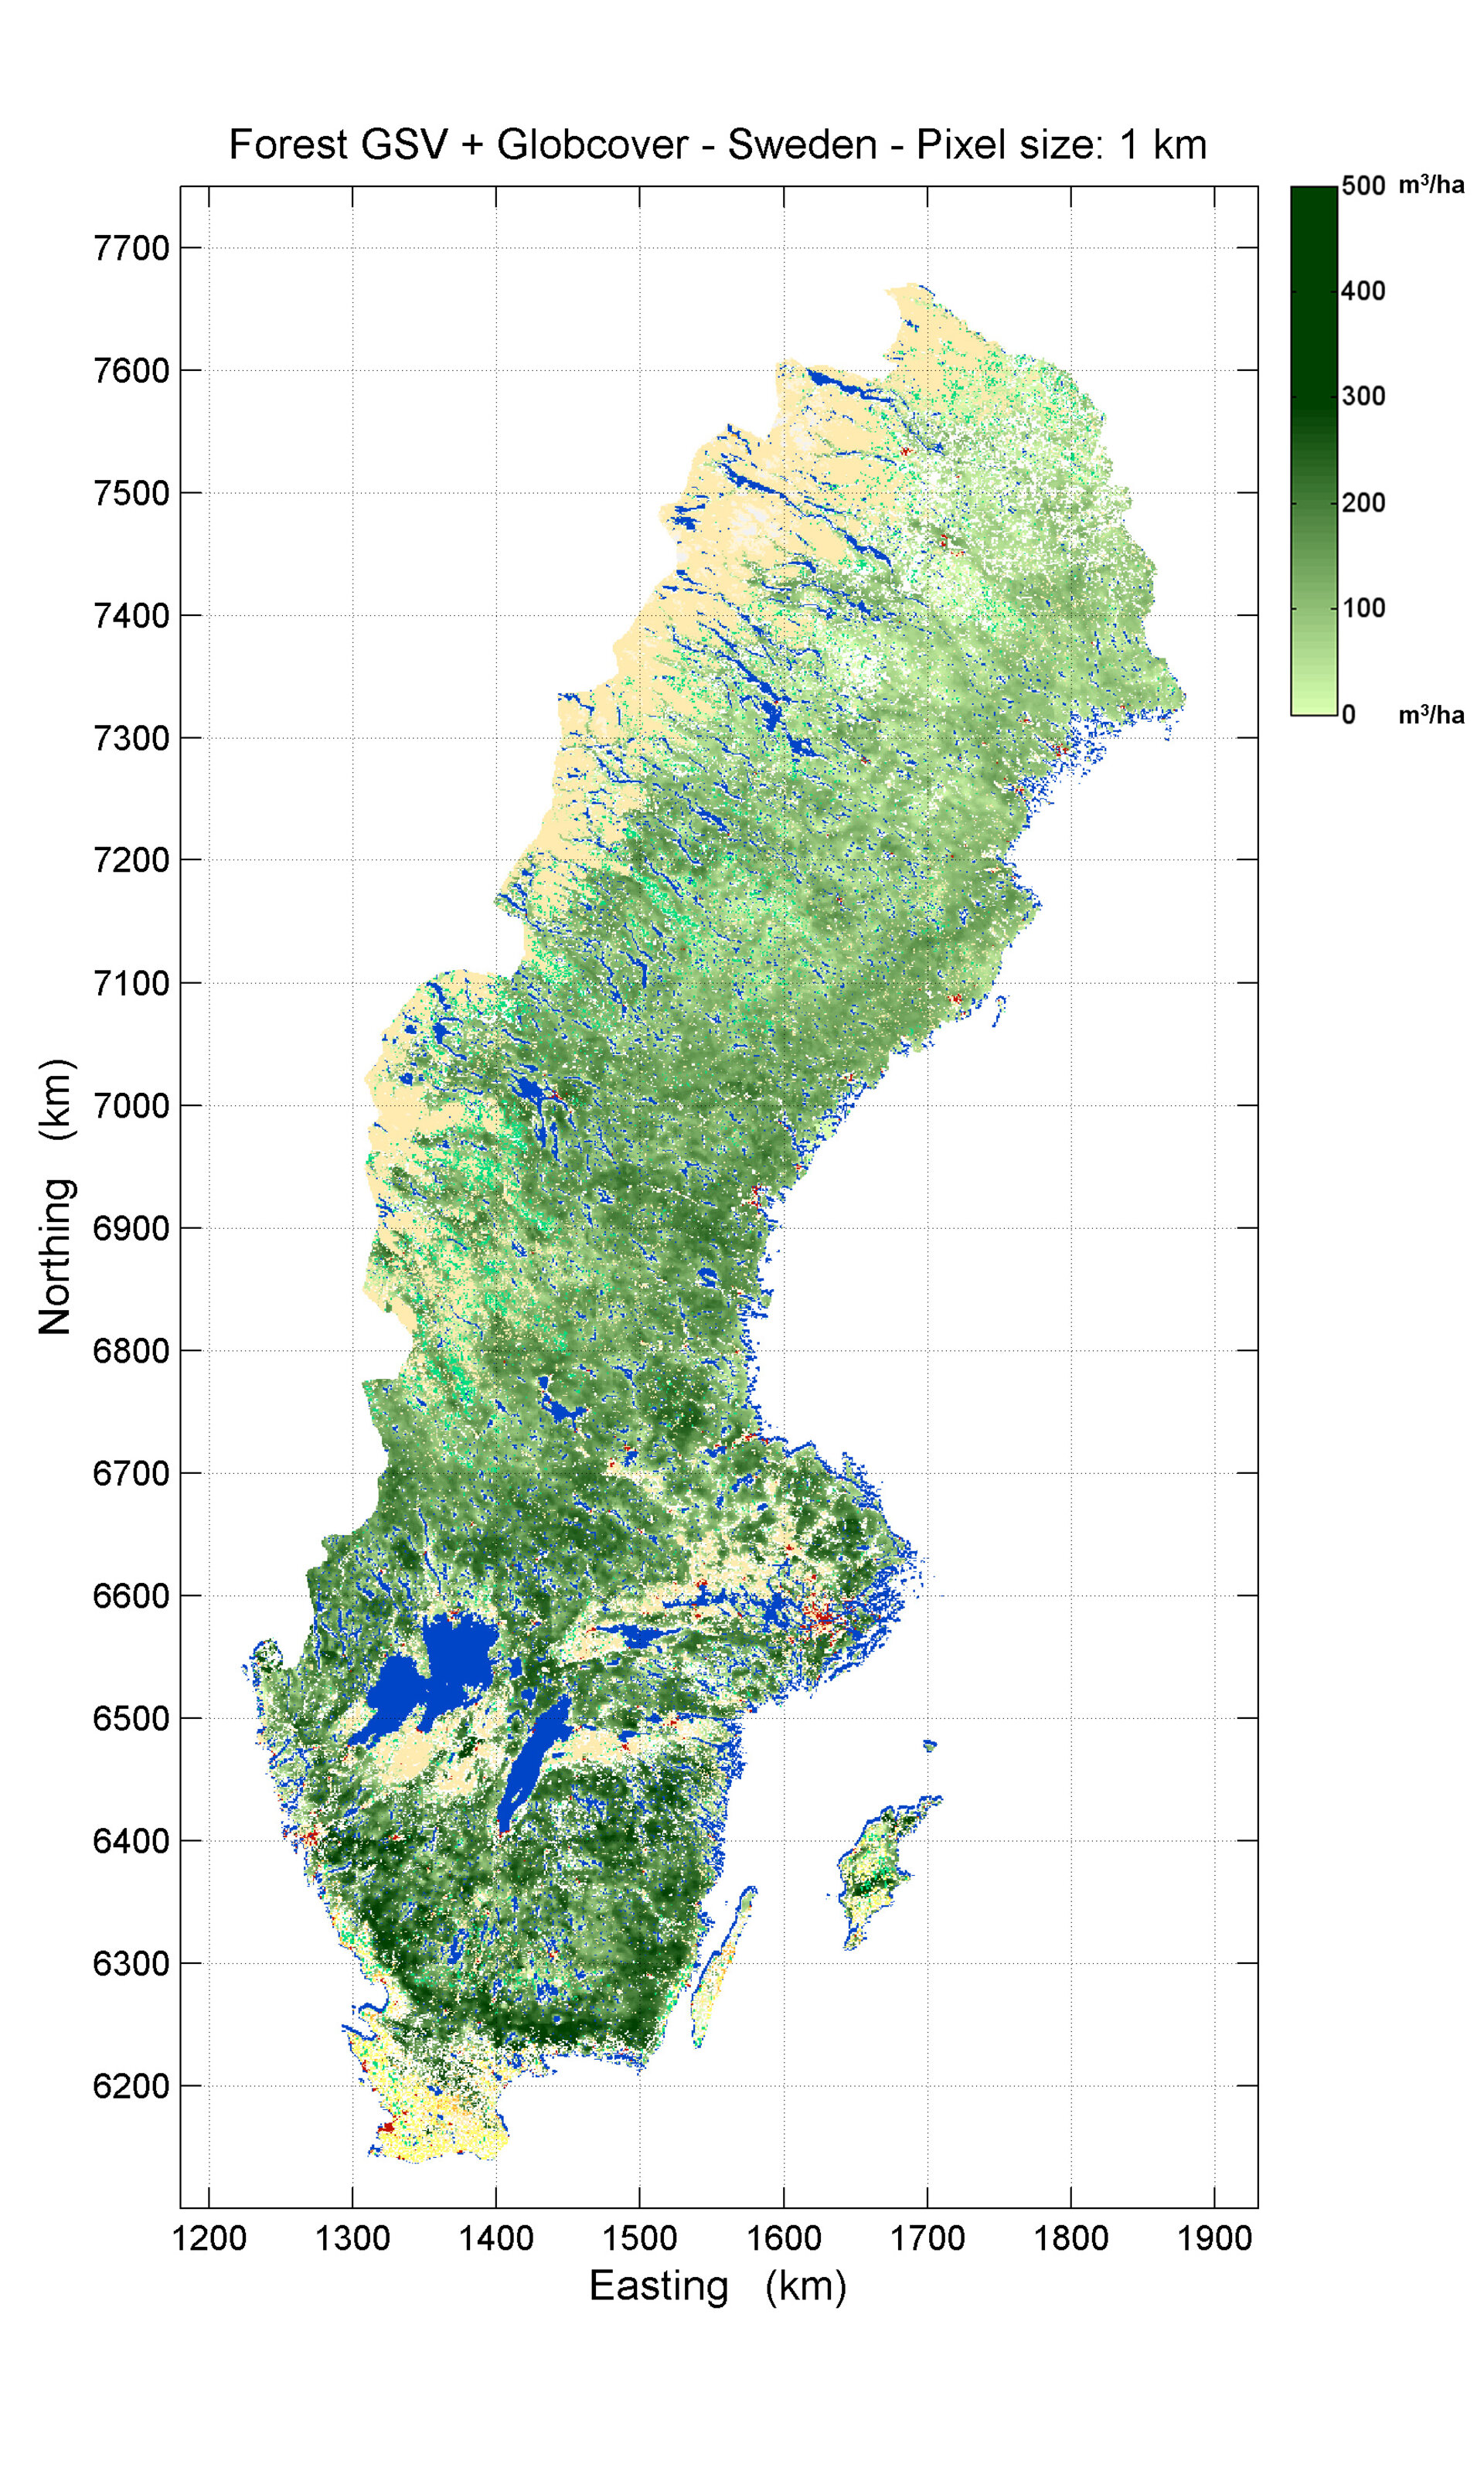
BIOMASAR Project
In 2010, a new processing algorithm was developed using stacks of images from Envisat’s radar that allows for the retrieval of boreal forest biomass well beyond the levels that had been previously reported. Using this method from the BIOMASAR project, Envisat archives were exploited to generate global maps of growing stock volume – the amount of wood expressed in cubic metres per hectare – yearly over the entire boreal ecozone with a resolution of 10 km and accuracies of 20%.

Interferometry
Envisat’s largest single instrument is the Advanced Synthetic Aperture Radar (ASAR). Two or more radar images over the same area can be combined to detect changes occurring between acquisitions – a remote sensing technique called Interferometric Synthetic Aperture Radar, or InSAR. Precise measurements – down to a scale of a few millimetres – can be detected across wide areas. This has proven to be a very useful tool in the area of disaster management, and Envisat has been providing data to aid relief efforts since the first year of its launch under the International Charter ‘Space and Major Disasters.’ Many remarkable results based on Envisat SAR Interferometry were presented at the 8th Fringe workshop in September 2011.
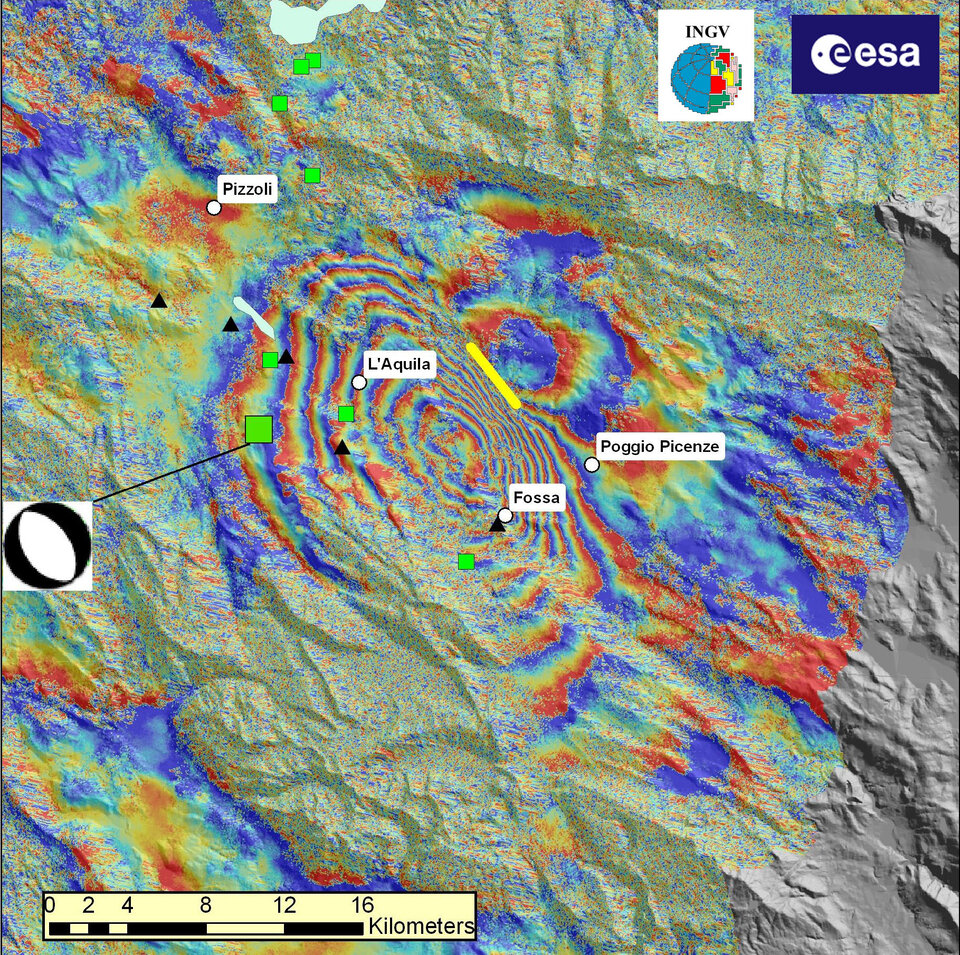
Earthquakes
In 2004, an earthquake and subsequent tsunami hit Southeast Asia. Radar data from Envisat was used to observe changes in land of stricken coastal regions. Under the International Charter ‘Space and Major Disasters’, rapid access to satellite data is given to aid workers and scientists in the event of a disaster like an earthquake. Envisat data has been used for this purpose continuously over the last decade. When an earthquake hit L’Aquila, Italy, in 2009, scientists exploited radar data to map the movement of Earth during and after the 6.3 earthquake. In 2011, Envisat helped map surface deformations caused by the magnitude-9 earthquake in Japan.
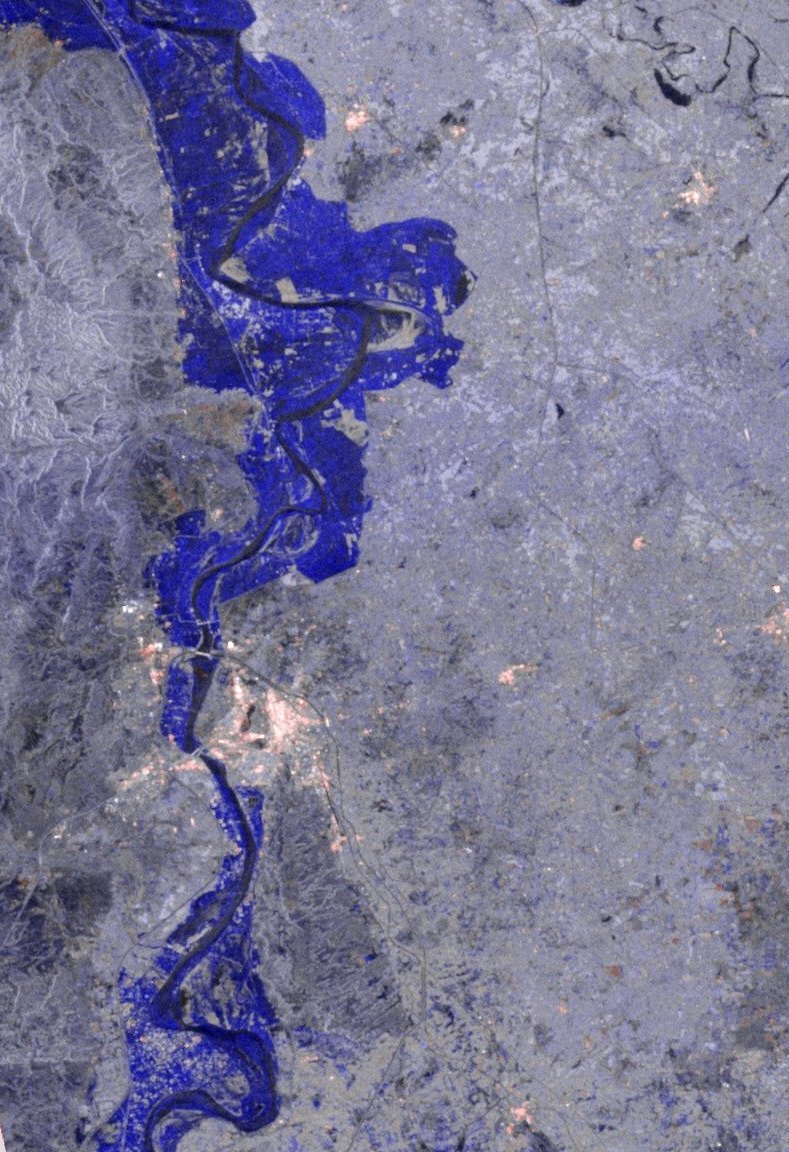
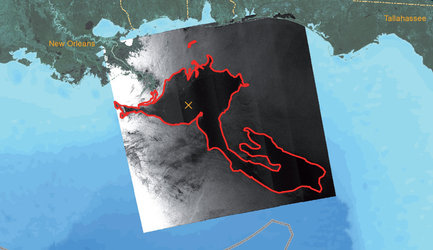
Floods
Further contributing to disaster relief, Envisat data can be used to generate essential maps of flooded areas. In 2010, flooding in Pakistan affected tens of millions of people. Under the International Charter 'Space and Major Disasters' maps were created using Envisat radar data to show exactly how far the flood waters have spread, enabling rescue teams on the ground to identify the best way to access those stranded and in need. This was especially important because the flood had affected such a vast area. More recently, Envisat’s radar imagery was used to map flooded areas in and around Campos dos Goytacezes, Brazil.
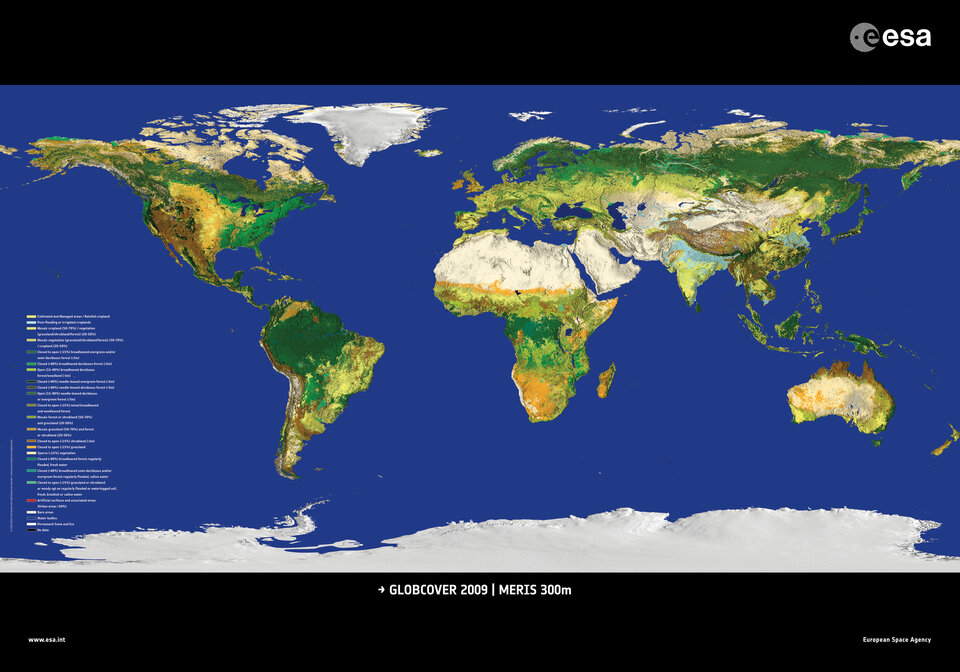
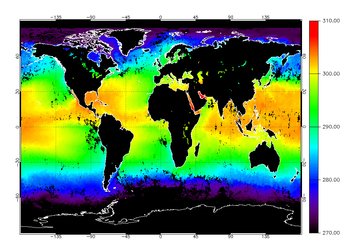
Global land cover map
Piecing together images from Envisat’s MERIS instrument, a global land cover map was produced under the Globcover project and presented to the public in 2008. At a spatial resolution of 300 metres, the map was ten times sharper than any previous global satellite map at that time. Updated maps and products were released over the years following. These maps are useful for modelling climate change extent and impacts, conserving biodiversity and managing natural resources.