

Expert’s Roundtable: ASAR interferometry promises hyper-accurate measurements from orbit
Interferometry – calculating the mutual interference caused by two or more signals – has long been used to measure small variations in distance. Space radars offer new capabilities to study the Earth’s surface with a level of detail never before possible.
The radar systems include those like the Advanced Synthetic Aperture Radar (ASAR) instrument on ESA’s Envisat satellite. With a combination of radar data and advanced interferometric analyses, a new generation of accurate digital elevation models (DEMs) of the Earth’s terrain can be created. These DEMs are valuable in a variety of applications including, regional development, humanitarian assistance and civil protection.
Interferometry using synthetic aperture radar (SAR) data also gives researchers a new set of tools to measure tiny shifts and deformations in the Earth’s surface, valuable in the study of volcanoes, earthquakes, floods and other natural cataclysms.
Satellite-based radar imagery allows researchers to obtain data on the amplitude of the signal (the radar image) and on its phase (the radar wave). This phase is directly linked to the distance between the observed terrain and the satellite sensor. By calculating the differences in phases (interferogram) between the two sets of data, researchers can determine ground displacements that have occurred in the time between the data acquisitions with a precision measured in millimetres.
An introduction
To take a look at how interferometry and space-based SAR data are proving to be a match made in the heavens, the ESA Web asked two leading experts in the field of signal processing to offer their explanations and insights into what these new tools are, and how they are changing the way we see our world.
Dr Fabio Rocca is a professor of digital signal processing at Politecnico di Milano, Italy, and was a visiting professor at Stanford University in the US. He is a member of ESA’s Scientific Advisory Committee for ASAR.
Dr Richard Bamler holds his doctorate in signal and systems theory from the Technical University of Munich, Germany. He is the director of the Remote Sensing Technology Institute of the German Aerospace Centre (DLR), Oberpfaffenhofen, and is currently researching algorithms for optimum information extraction from remote sensing data, with particular emphasis on SAR and SAR interferometry.
Could you provide a brief explanation of interferometry?
Dr Bamler: Interferometric techniques – be it in astronomy, in material testing, or in SAR – all measure small variations of distance by comparing the mutual phase shift of two or more waves. The measurement is extremely sensitive, because it can detect shifts in the order of a small fraction of a wavelength.
Think of it this way: imagine you have two identical fences, constructed of equidistant parallel vertical bars – these are our two waves. If you put one fence behind the other, a shift as small as half of the distance of the bars (the wavelength) will turn our fence sandwich from partially transparent to opaque. This works even if you are so far away that you cannot resolve the individual bars.
Envisat’s ASAR sensor uses a wavelength of 5.6 cm and hence, interferometry with ASAR allows us to measure differences in distance in the order of centimetres, or even millimetres.

Dr Rocca: Consider two sound waves at the same frequency coming from two identical sources. In any given position, they interfere with each other, i.e. they add or subtract. Their positive or negative combination depends on the difference of the number of wavelengths (a 5000 Hz wave has a wavelength of 6.6 cm) that corresponds to the distances between the point and the two sources. If the two distances differ half a wavelength, (i.e. 3.3 cm), the sources will subtract; if they differ of an integer number of wavelengths, they add.
An interferogram is a map of the difference of the distances from the two sources to any point. We can map in colour the ratio between the average of the two waves and one of them. Thus, we get the so-called "interferometric fringes," corresponding to what we see when we illuminate an oil slick with a white light. The interference of the two waves reflected from the top and the bottom of the slick cancels one part or other of the light spectrum, thus colouring the reflected light with a pattern dependent on the thickness of the slick, that can be measured with a great precision.
Would you explain SAR satellite imagery. How do interferometric techniques help analyse SAR data?
Dr Bamler: SAR is an active microwave imaging method. A radar onboard a satellite illuminates the Earth surface in a side-looking fashion. The transmitted waves are reflected back from the objects on ground and are recorded by the receiver in the satellite.
In this way – and after further processing of the recorded signals – we generate an image of the radar reflectivity of the Earth surface. Since not only the power of the wave is recorded (this gives the brightness of a point in the images), but also the relative delay when it is received, we can use interferometeric techniques known as Interferometric SAR, or InSAR. To do that, we need at least two SAR images.
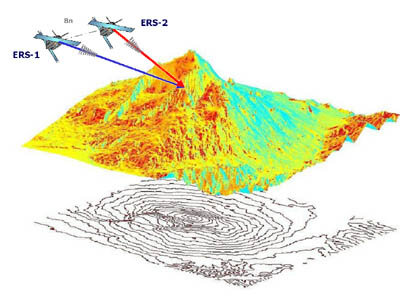
If the two images are taken from different positions, say, a few hundred metres apart, the same area on ground is seen from two slightly different angles and we have a kind of stereo camera. The interferometric principle, i.e. the comparison of mutual wave shift, gives us the stereo parallaxes to within a fraction of a wavelength at every pixel of the images. From these we can compute a digital elevation model (DEM) of the Earth surface – a three-dimensional map.
If the two images are taken from the same position but at different times, we can measure deformations as small as centimetres of the ground surface between the two instances when the images were taken. These distortions can be caused, for example, by subsidence or volcanism. This type of interferometry is known as differential interferometry, or DInSAR.
Like our earlier fence experiment, this accuracy is much higher that the resolution power of the SAR, which is about 20 metres. It is also astonishing that SAR interferometry allows us to measure such small earth movements accurately from more than 800 km away.
Dr Rocca: Interference happens also with the radio waves emitted by a satellite-mounted radar like the one on Envisat. This satellite passes over the same location, every 35 days, and the wavelength used for the illumination is 5.6 cm.
In order to obtain the interferogram, the waves reflected from the ground are recorded onboard Envisat. They cover the two-way travel path, to the Earth and back to the satellite. The return signals to the satellite from each target are combined to simulate the effect of a very thin beam originating from the orbital point closest to the target. We get one reflection every 100 meters square (5x20m) of terrain.
The interferogram now compares the results of the two satellite passes. If the new orbit of the satellite is very close to the previous one (less than 10 m, for example), and if a building moved 1.25 cm along the line-of-sight, it would disappear altogether from the combination of the two images, (DInSAR). In fact, the two-way travel path would have changed by 2.5 cm (half wavelength). We are talking of reflections now, so the cancellation does not happen if the amplitude of the return changes for any reason.
If, on the other hand, the two orbits are far away (say, 150 m), then the interferogram depends also on the relative elevations of the targets. In these cases, we can derive a very precise DEM of the terrain, (InSAR). The wider the baseline (the distance between the orbits), the better the precision. In mountainous areas and for wider baselines, however, the interferometric fringes become too crowded and are hardly separable.
This is useful in which types of research applications?
Dr Rocca: The main goal of InSAR is to produce DEMs for the entire globe. These are useful for all sorts of topographic applications. The precision that can be obtained is lower, but not that far from that obtained with the much more expensive air or ground surveys.
The capability of measuring terrain motion obtained with DInSAR is practically unique. It has been proven to be better and far cheaper than with optical levelling. It also is extendable to wide areas (and not just to optical levelling lines), and to the past, since ERS images are available since 1991. Note that for each point on the ground for most of Europe, data on more than 100 satellite passes are available for the last 10 years. The combination allows a detailed analysis of terrain motion in space and in time.
Dr Bamler: The major applications, indeed, of InSAR are to generate DEMs and monitor surface deformation and terrain motion.
DEMs are used in all kinds of geo-scientific disciplines, e.g. in geology, where the shape of the Earth surface is of interest, and in hydrology for modelling water runoff. Surface deformation measurements are indispensable for earthquake and volcano research. In contrast to isolated ground measurements, DInSAR data give a full map of the motion and, thus, reveal the shape of the deformation pattern. DInSAR measurements of glacier motion, for instance, are used extensively by glaciologists.
For what types of general-public applications is this useful?

Dr Bamler: DEMs are the basis for all geo-information applications. This includes regional planning, humanitarian aid, telecommunications, inundation warning, air traffic safety, and defence. A large archive of InSAR data, like the ones acquired by ERS-1, ERS-2 and now Envisat/ASAR allows us to rapidly produce a DEM of virtually every part of the world. This is important for humanitarian aid and other applications in areas where accurate maps are missing. Another application for DEMs is in the planning of large construction projects like dams, airports and trans-continental high power lines where the topographic information is an important time and cost factor.
Deformation and motion measurements by DInSAR are used to monitor landslides, active seismic areas, volcanoes, and subsidence in cities and mining areas.
Dr Rocca: The topographic applications are very important for defence, air traffic, water runoffs studies, and, in general, for all sorts of geographic applications.
The DInSAR applications are new and developing fast, to control subsidence, volcano inflation or deflation, landslides, ground motion preceding or following earthquakes. Moreover, man-made structures like dams and underground excavations can be monitored to control their effects on buildings or the surrounding terrain. Further, the effects of oil and water pumping on land can be monitored to identify law infringements and emerging risks.
What specific capabilities of Envisat 's ASAR affect InSAR-based analyses of the Earth's surface?
Dr Rocca: The principal innovation of the ASAR radar with respect to the one in ERS satellites is the electronically steerable antenna, which allows the scanning of wider areas - 100 km for ERS, compared with up to 400 km for Envisat. This allows faster revisit times (up to four days instead of 35) for better surveillance. The flexibility of the instrument is also extremely useful in the cases of emergencies.
Dr Bamler: The so-called ScanSAR mode of Envisat’s ASAR produces much larger images during a single acquisition. Such an image can be several hundred kilometres wide.
A further improvement is the accurate orbit that we expect for Envisat thanks to the DORIS instrument, a microwave tracking system that allows the position of Envisat to be fixed to within a few centimetres. The more accurate the orbit, is the more accurate and automatic the InSAR data processing can be.
ASAR can also record images at different wave polarizations. In conjunction with InSAR, this opens new research fields. In particular, it helps to discriminate between different surface types, like bare soil, grass, or forest.
The interferogram produced from Envisat data -- what useful information or other applications can be derived from that?
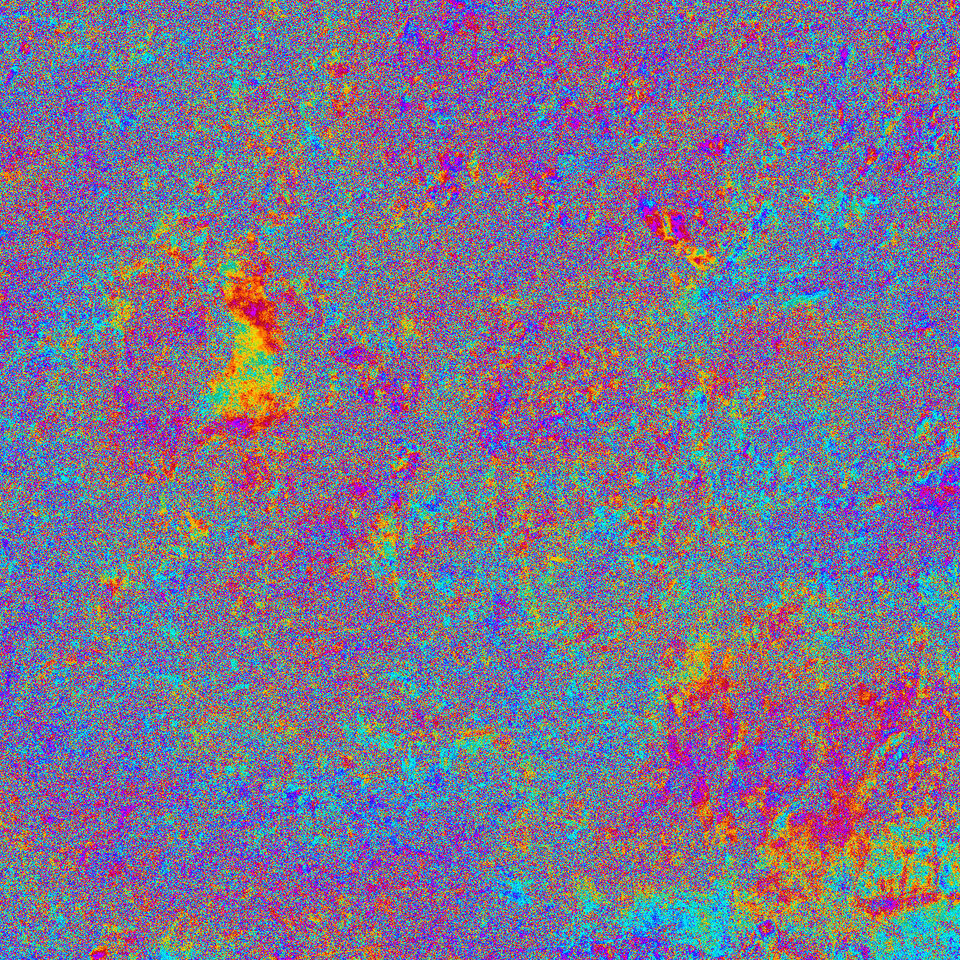
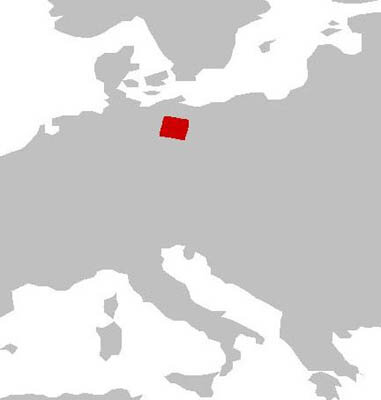
Dr Bamler: For our first experiment we have picked a pair of ASAR images over an area around Berlin. The purpose was to demonstrate that interferometry works with ASAR. For the area selected we knew from earlier simulations how the interferogram should look like. The ASAR interferogram fully met our expectations. The quality is good and the processing systems developed for ERS-1 and-2 can be used without major modifications.
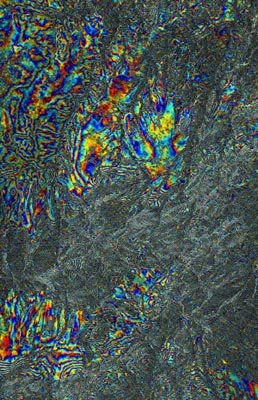
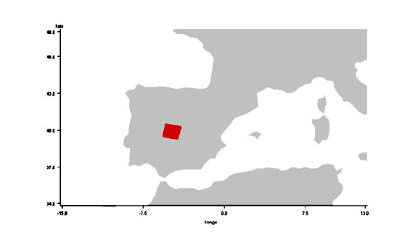
Dr Rocca: This 10x10km interferogram corresponds to an area in Spain and the interferometric fringes correspond to an elevation change of about 25m. The consistency of the targets is rather good so that the interferometric fringes are well visible even after 35 days. The areas where they are indistinct correspond mostly to slopes facing the satellite, since these echoes return nearly simultaneously and the fringes coalesce. These slopes become visible when the satellite looks in the opposite direction. To be honest, the quality of the DEM that could be generated from this interferogram is impaired by unknown but smooth atmospheric delays that could amount to about half fringe. This error is reduced by combining images from several satellite passes.
What are some of the benefits, either actual or potential, of InSAR techniques?
Dr Rocca: The main applications for INSAR are for topography, but also for glacier studies. The main applications we foresee for DIFSAR are in monitoring environmental hazards (landslides, subsidence due to water and oil pumping) and earthquake studies. Longer term, we foresee single-building monitoring to help predict the collapse of structures, be it due to subterranean cavities or to technical problems. The implications for insurance, civil protection, etc, are clear.
Dr Bamler: The most obvious use for InSAR derived DEMs will be in planning, defence and foreign policies. The growing market of geo-information needs DEMs, too. Geographic information systems will increasingly replace maps on paper and are becoming indispensable planning tools. Optimum planning of cellular phone networks in developing countries requires the modelling of the wave propagation in the three-dimensional reality. Exploration companies use DEMs to identify surface features that may be indicators for oil or mineral deposits. Hydrological modelling and flood warning require DEMs – and not only in our part of the world, but also in badly mapped developing countries. Another increasingly important application is the avoidance and management of soil erosion."
Thank you both very much for your comments and for sharing your expertise with the ESA Web.
