New map offers precise snapshot of human life on Earth
A landmark global map showing nearly every human settlement on Earth is now available to researchers. Compared to previous mapping efforts, the satellite-based ‘Global Urban Footprint’ dataset shows not just urban centres, but also tiny rural hamlets.
The black-on-white Global Urban Footprint (GUF) map is a portrait of the human presence on Earth in 2012, to a maximum resolution of 12 m, covering even single houses.
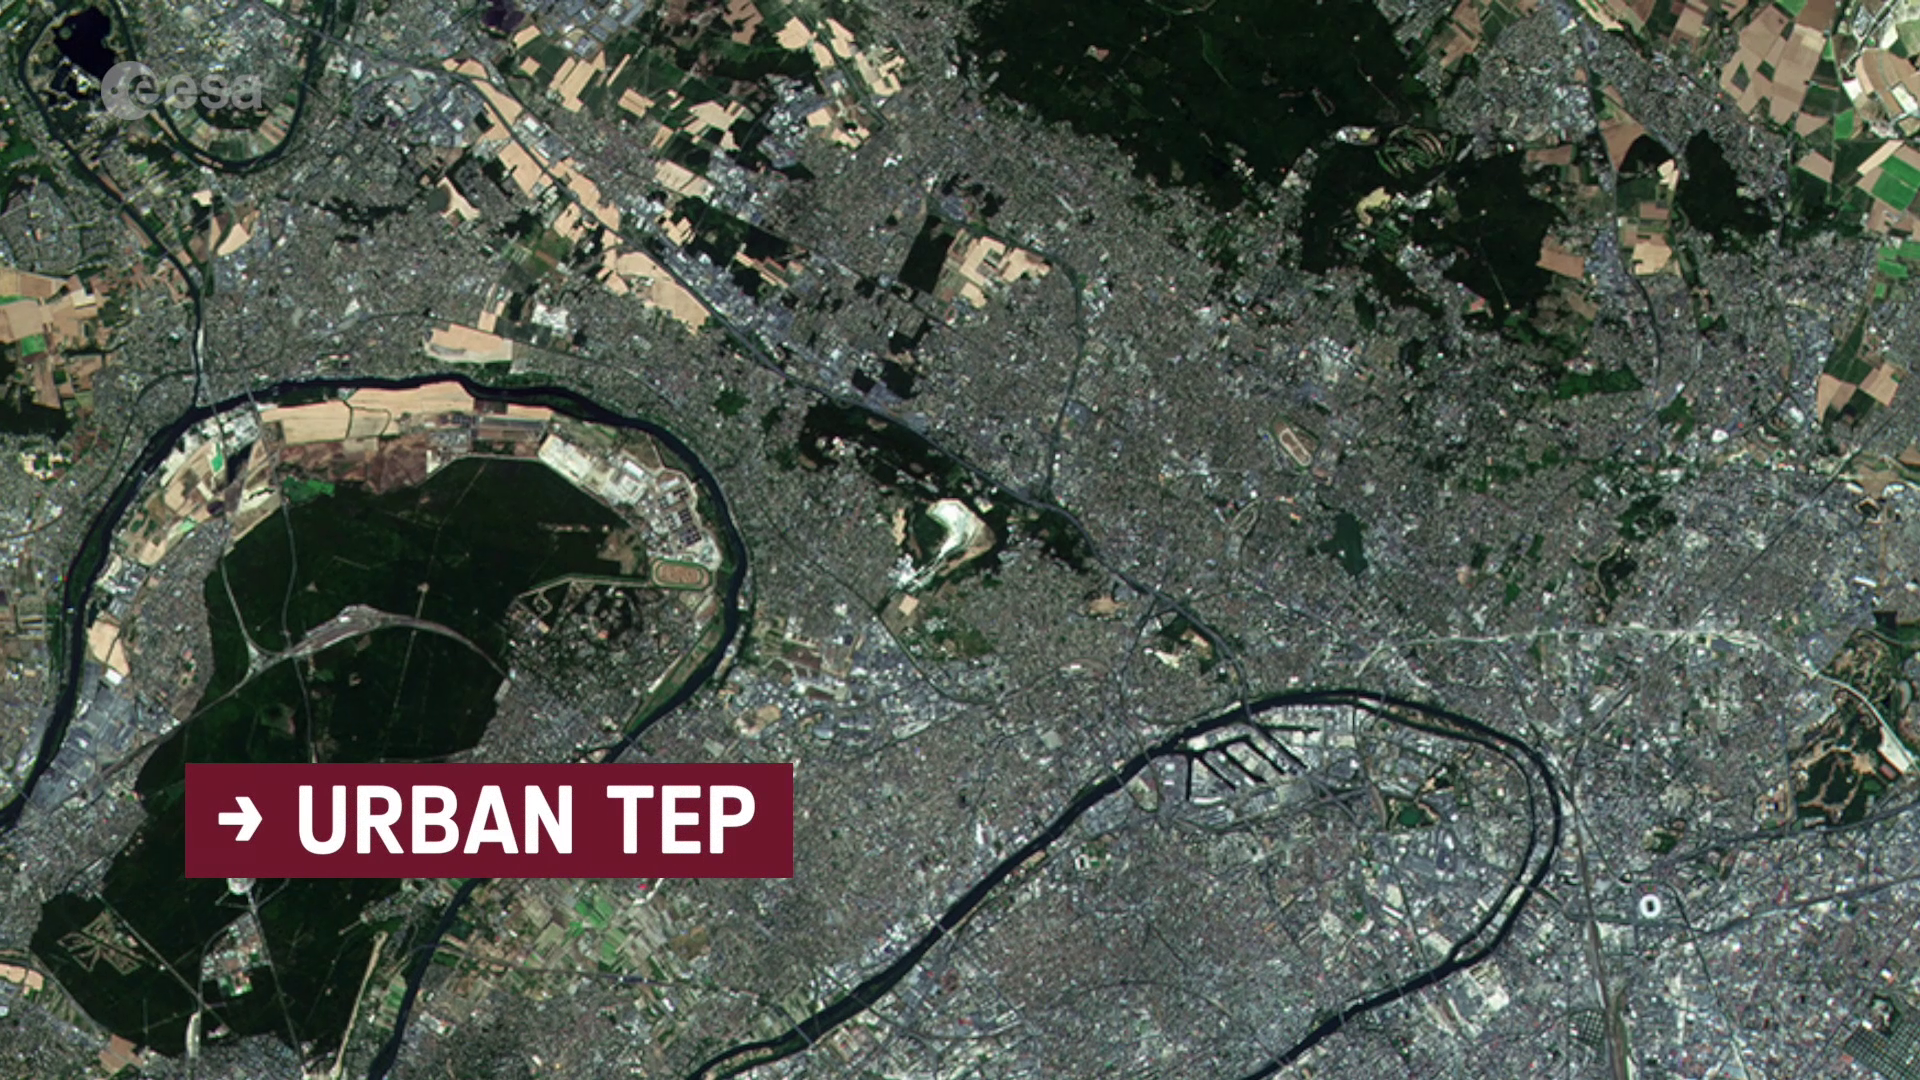
Starting this month, the GUF 2012 dataset is freely available via ESA’s online Urban Thematic Exploitation Platform (U-TEP) at full spatial resolution of 12 m for scientific use, along with an easier to handle 84 m version for any non-profit use.
“Previously we just weren’t getting all the villages in rural areas,” says Thomas Esch of DLR German Aerospace Center, which produced the map. “But these might be crucial to understanding population distribution or disease vectors, for example, or assessing pressures on biodiversity.
“Such rural settlements are currently still home to almost half of the global population – around three billion people.”
“U-TEP will provide a tremendous service to all of us working with the world’s cities,” comments Ellen Hamilton, Lead Urban Specialist at the World Bank.

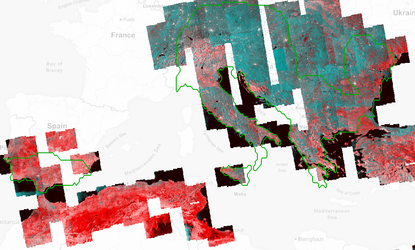
Orbiting astronauts find it notably difficult to spot any signs of human habitation with the naked eye – until nightfall, when artificial lights switch on. This GUF 2012 map was made using primarily radar vision because it can detect vertical structures typical of built environments, working on an all-weather basis.
German radar satellites TerraSAR-X and TanDEM-X acquired more than 180 000 high-resolution images covering all of Earth’s surface over two years.
This 3 m-resolution satellite imagery is almost 100 times more detailed than US Landsat optical data, commonly used for mapping urban extent.
The radar data were combined with additional inputs such as digital terrain models. In all, the team processed more than 20 million datasets with an input volume of more than 320 terabytes, including an automated quality assurance check – aiming to ensure maximum accuracy, as a yardstick of urbanisation patterns.

ESA’s U-TEP platform has now been used to process a new auxiliary optical layer for the map based on more than 400 000 Landsat multispectral images – giving an added dimension of information to users.
Handling such a huge dataset only became practical thanks to ESA’s cloud-based U-TEP, which provides all the computing resources needed. “Even five years ago the technology wasn’t there,” says map team member Mattia Marconcini – it would have been impossible.”
This new auxiliary layer is also serving as a basis for a follow-on “Global Urban Footprint +” map for 2015 derived from Landsat in combination with Europe’s Sentinel-1 satellite imagery and showing a spatial resolution of 30 m.
Ultimately on-demand Global Urban Footprint processing will be made available to users for any time and any place on Earth through the U-TEP and Europe’s Sentinel-1 and Sentinel-2 data.
U-TEP is one of six Thematic Exploitation Platforms developed by ESA to serve data user communities. These cloud-based platforms provide an online environment to access information, processing tools and computing resources for collaboration. TEPs allow knowledge to be extracted from large environmental datasets produced through Europe's Copernicus programme and other Earth observation satellites.

Access the video