Applications
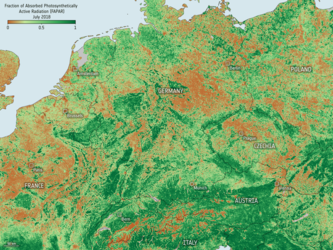
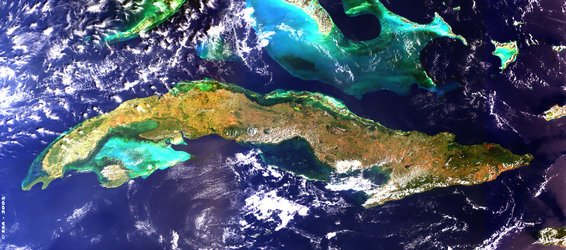
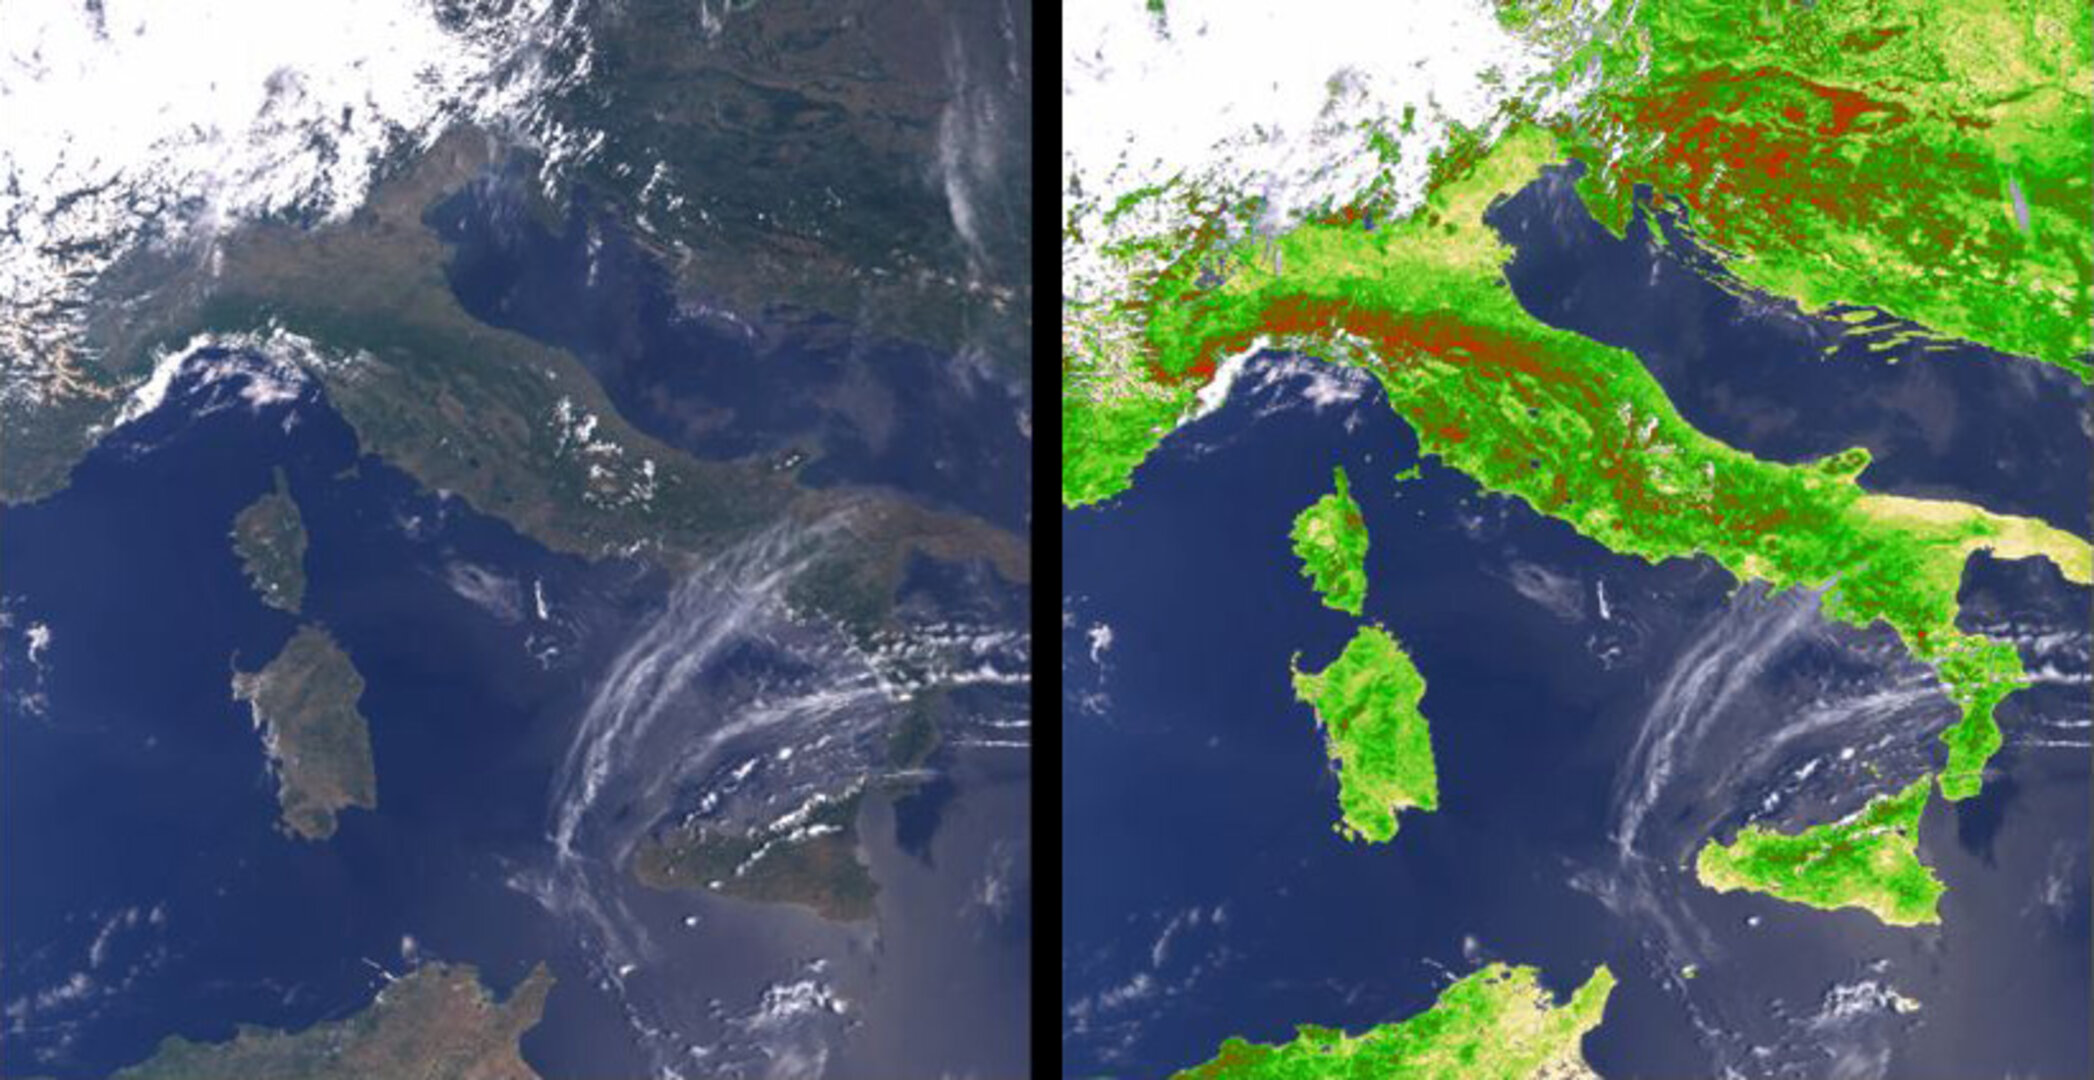
MERIS radiances (left) used for generating FAPAR map (right)
MERIS radiances at the top of the atmosphere (left map) used for generating the FAPAR map (right map) over Italy. The red regions correspond to agricultural zones for which there is high photosynthetic activity and therefore vegetation productivity and yellow to white areas indicate a low degree of photosynthetic activity.