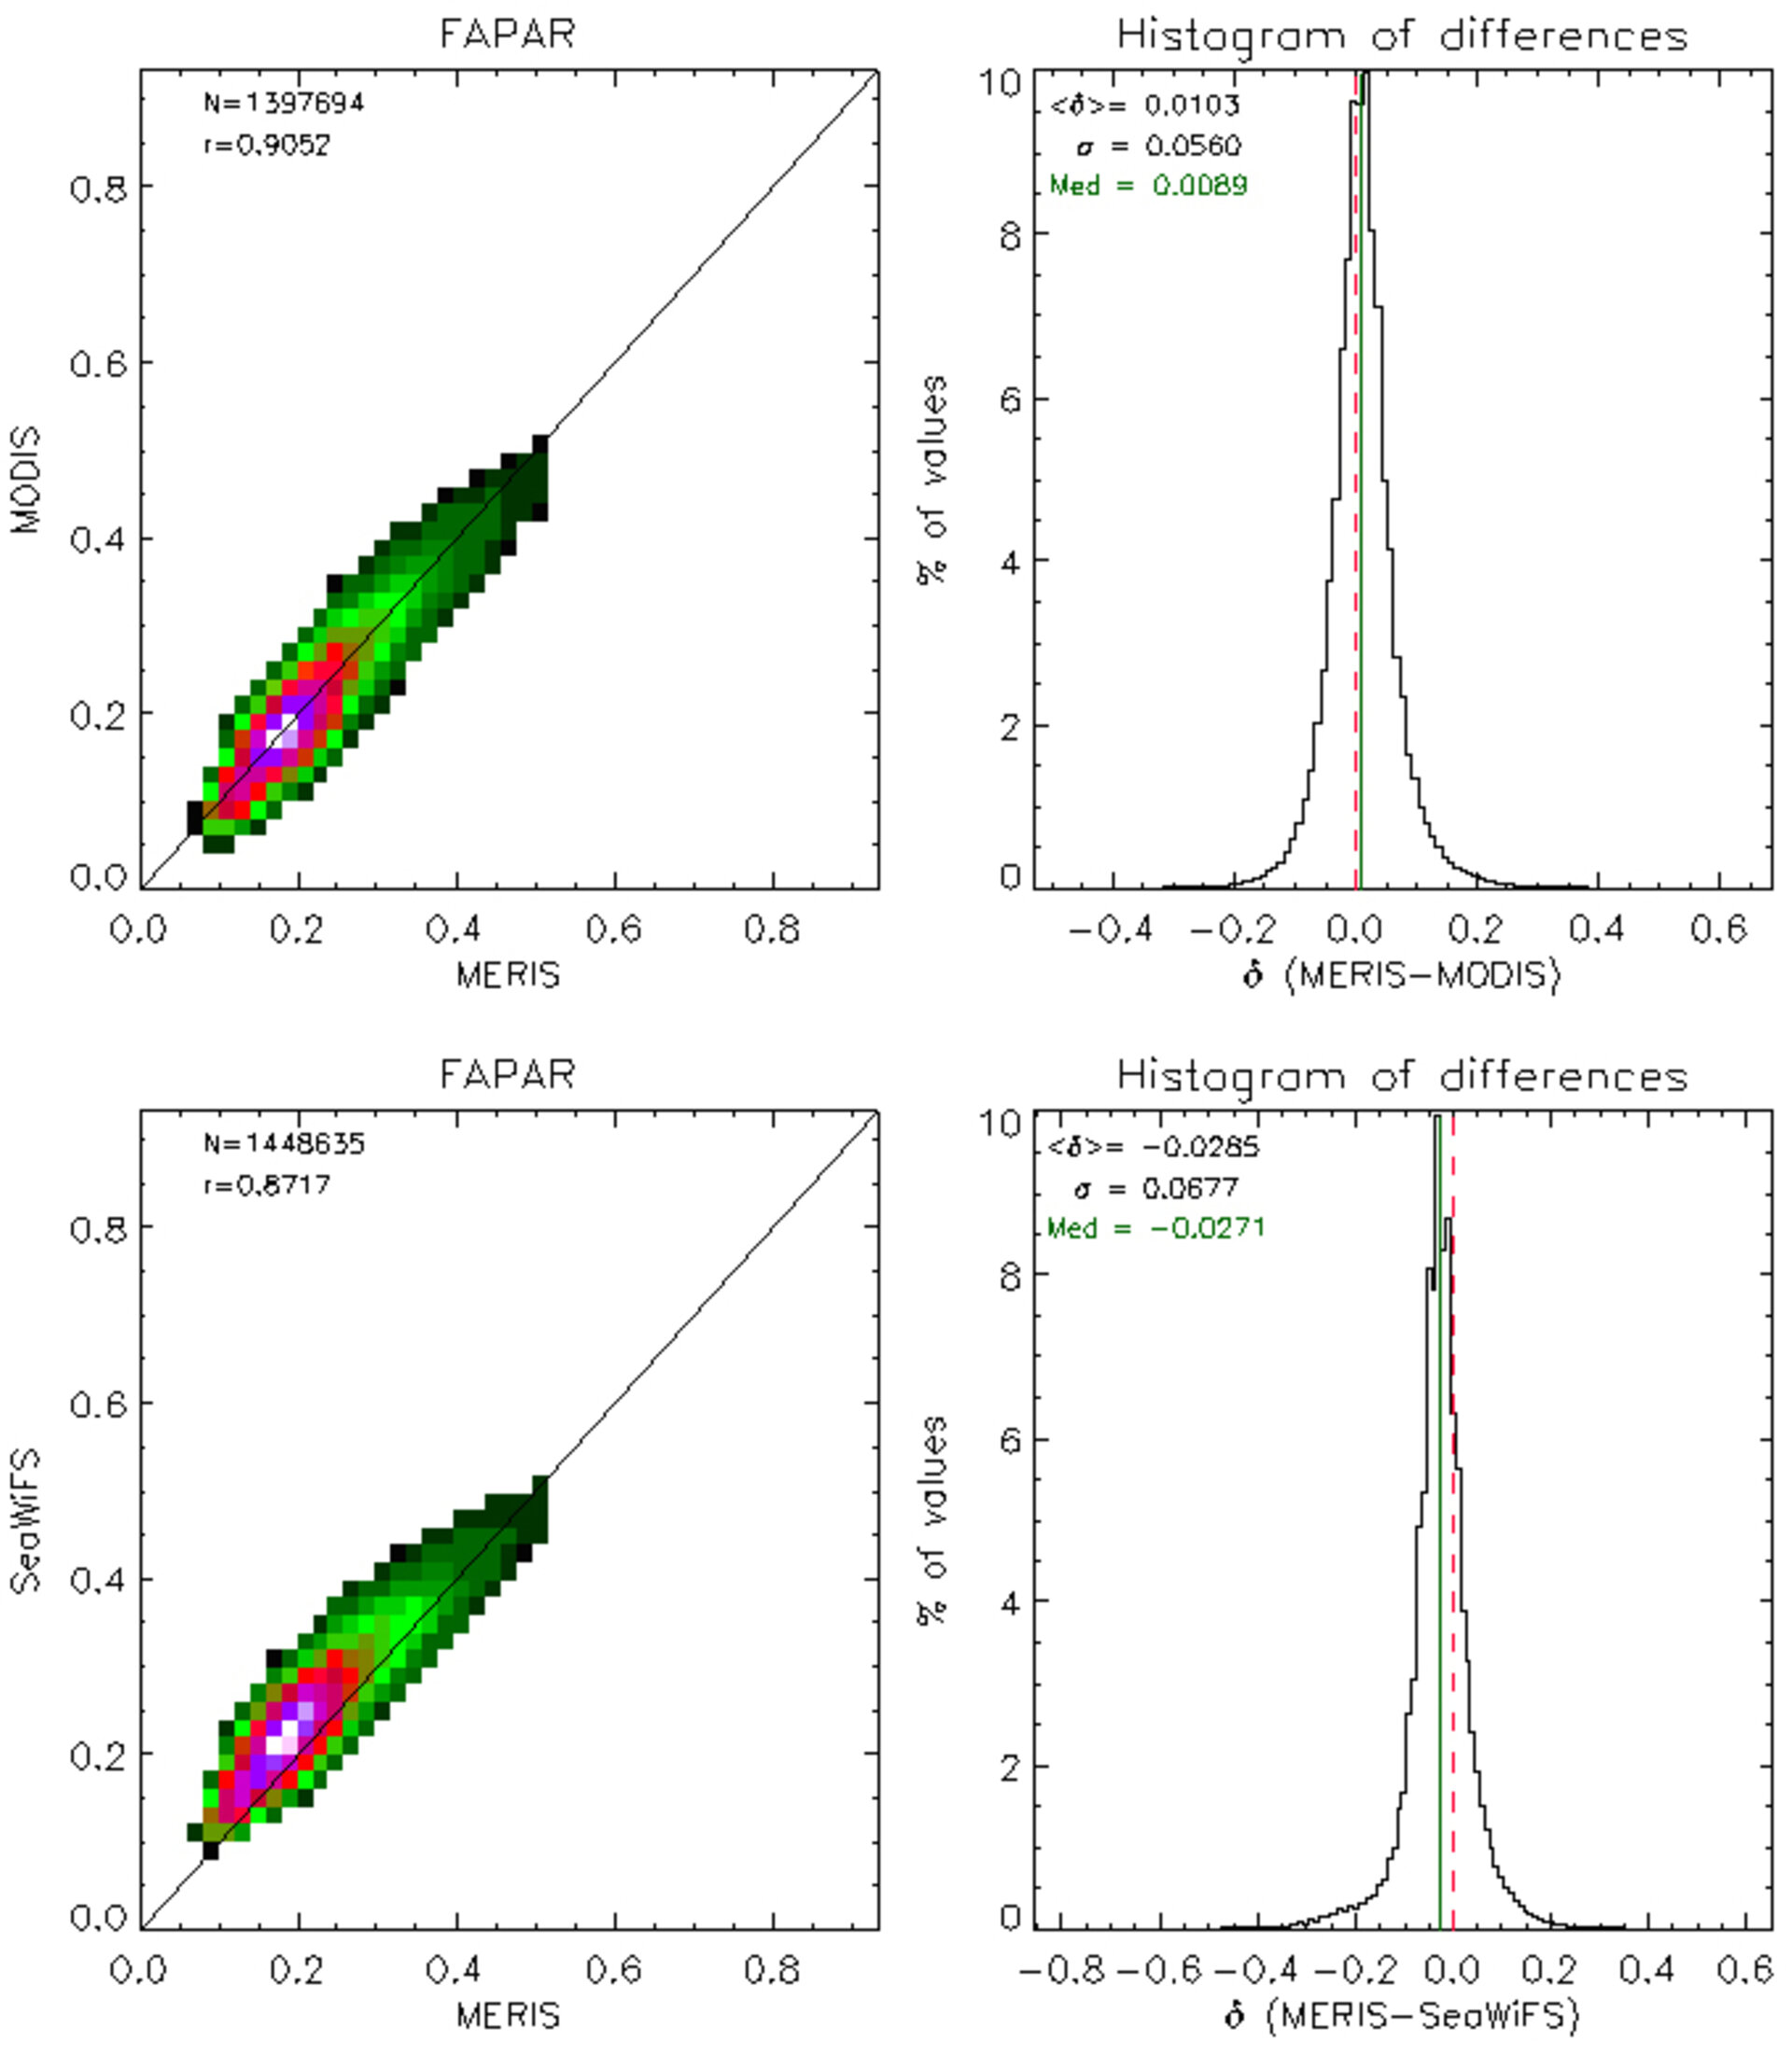
Scatter-plots and histogram of difference between FAPAR values remapped or aggregated at 2.0 km from MODIS or SeaWiFS and MERIS
Scatter-plots and histogram of difference between FAPAR values remapped or aggregated at 2.0 km from MODIS or SeaWiFS (y-axis) and MERIS (x-axis) over Europe in April 2003. N indicates the number of pixels, r the correlation, the mean of differences, σ the standard deviation and Med the median value of the differences.
The validation of the MGVI products should continue during the life time of the instrument in order to assess the quality of the land surface products which also depends on the processing version on the Level 1 data. The inter-comparison is essentially conducted here with the first version of the processing. This requires further analysis with newly reprocessed data to better understand the small differences especially at the daily level. Using the full resolution (FR) MERIS Level 2 products would be instrumental in confirming the current results. The time-composite technique is also very important in order to conserve the statistical distribution of both the composite and daily values at various spatial and temporal resolutions. The maximum value technique used by other agencies implies systematic biases towards the highest values of the geophysical products over a given time period.