Agency
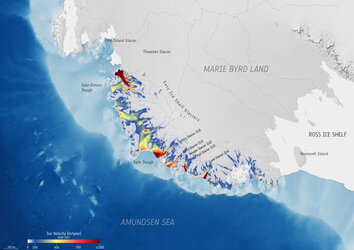
Ice-velocity map
An example of a two-dimensional ice-velocity map of the study area in southwest Greenland. The map is derived from Synthetic Aperture Radar images from ESA's veteran ERS-1 satellite separated by 35 days: 2 June to 7 July 1995.