10. Image processing exercise using LEOWorks
Inspecting an image
Start LEOWorks 3.0
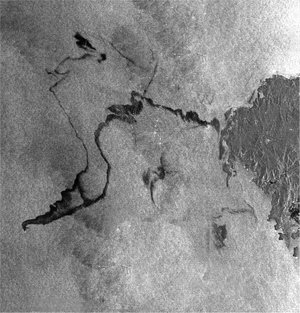
Open the file LS7_190_31_09062001_B01.tif
Band 1, Landsat 7 image of Alban Hills
To inspect the distribution of the pixel values in the image choose Histogram.
Histogram for LS7_190_31_09062001_B01.tif
It is seen that the pixels have values in the range of 62 to 137. The pixel values are visualised in the gray scale image where pixel value 0 is shown as black and pixel value of 255 is shown as white. Therefore the image is gray with little contrast.
Choose View/Image Values to open a window with the matrix of the pixel values.
Matrix showing the pixel values of LS7_190_31_09062001_B01.tif. The area covered is the upper left corner which has pixel values
Rate this | Views |
Share |
- Currently 0 out of 5 Stars.
- 1
- 2
- 3
- 4
- 5
Rating: 0/5
( 0 votes cast)
Thank you for rating!
You have already rated this page, you can only rate it once!
Your rating has been changed, thanks for rating!
| 32 |
|
Rate this
Views
Share
- Currently 0 out of 5 Stars.
- 1
- 2
- 3
- 4
- 5
Rating: 0/5 (0 votes cast)Thank you for rating!
You have already rated this page, you can only rate it once!
Your rating has been changed, thanks for rating!