10. Image processing exercise using LEOWorks
Computing NDVI
Scientists have found that many surfaces have distinctive spectral signatures that are apparent within certain wavelengths or channels. For instance, to distinguish between bare ground and vegetation a sensor should scan in the area between 0.6-0.7 micro-metres (red colour) and 0.7-0.9 micro-metres (near infrared). Vegetation will give a strong reflection between 0.7-0.9 micro-metres, whereas it will weakly reflect between 0.6-0.7 micro-metres.
The spectral signature of vegetation is quite characteristic so the distinction between it and bare ground is usually straightforward. The difference between radiation reflected in the visible wavelength red and near infrared can be used to determine more detail about the vegetation such as its photosynthesis and vegetated ground cover.
The Normalized Difference Vegetation Index (NDVI) is usually calculated as
| NDVI= | near infrared - red |
| near infrared + red |
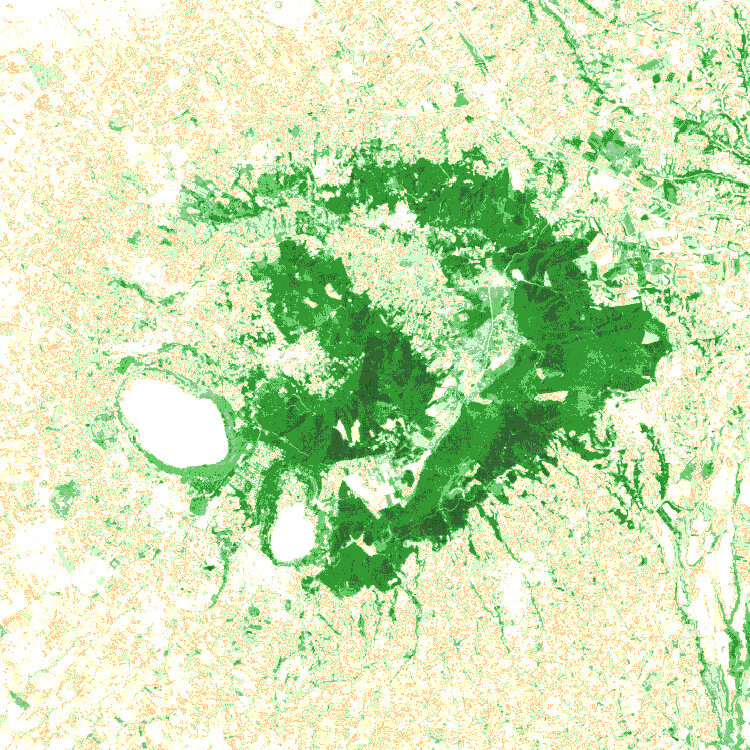
Now create a NDVI image of the Alban Hills area.
Choose Tools/Compute NDVI.
Using the Alban Hills images select 'LS7_190_31_09062001_B04.tif' as the infrared band and 'LS7_190_31_09062001_B03.tif' for the red band and click OK.

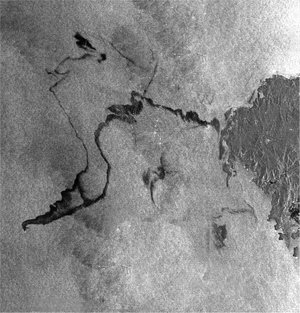
Compare the image with the natural colour image and the false colour image.