"A breakthrough in our capabilities to learn about earthquakes"… Interview with Yuri Fialko
Professor Yuri Fialko is a geophysicist who is looking up to look downward: he is using radar satellite data to chart tiny changes in surface topography - gaining insight into what is actually happening as earthquakes and tectonic shifts occur deep beneath the surface of the Earth.
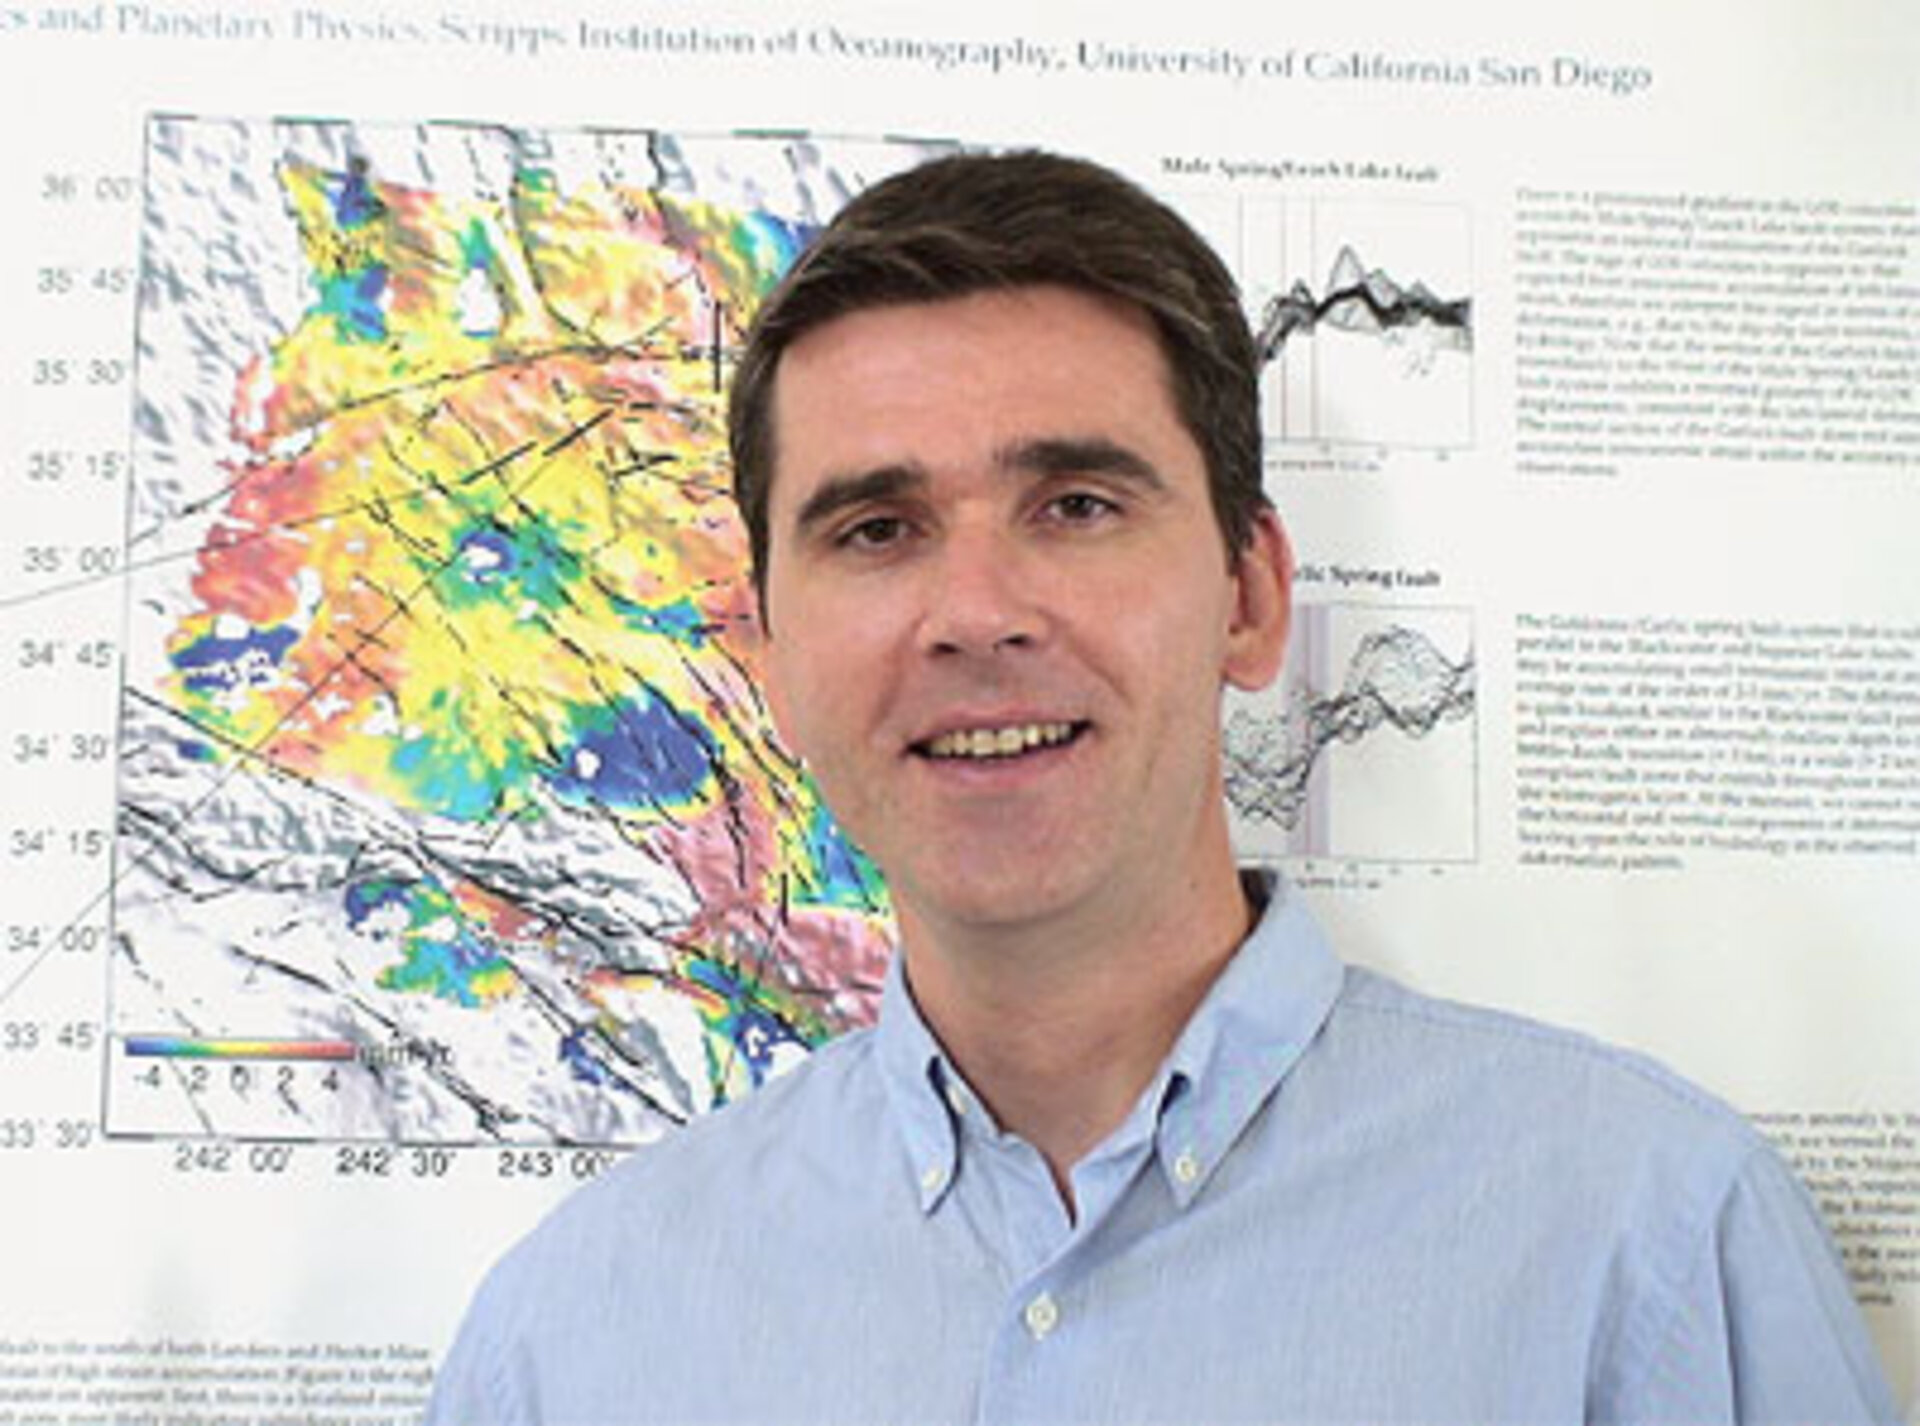
Born in Ukraine, he studied at Princeton University and is today Associate Professor at the Institute of Geophysics and Planetary Physics at the Scripps Institution of Oceanography at the University of California San Diego. Prof. Fialko is one of a group of researchers who have been harnessing ESA satellite data from the past 15 years to analyse the movements in the planetary crust that are both the causes and consequences of earthquakes.
Looking down at the Earth from 800 km away in space provides a way to identify tiny sub-centimetre shifts in the planet's surface across tens of kilometres that might otherwise go unseen. It is done using a technique called Synthetic Aperture Radar (SAR) Interferometry, or InSAR for short.
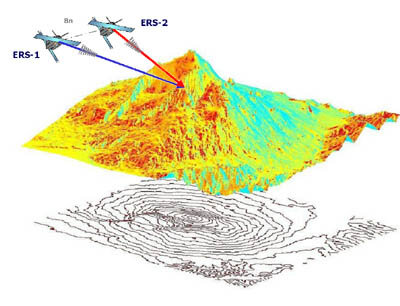
Through inSAR, multiple satellite radar images of the same site - acquired from as near as possible to the same point in space though at different times - can be combined together to highlight slight changes in surface motion occurring between the image acquisitions.
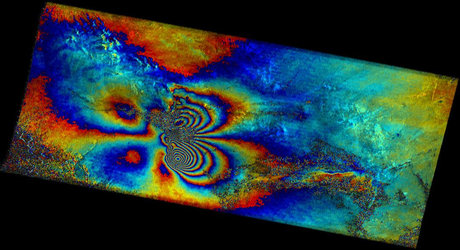
Even the tiniest surface shift changes the distance it takes for the radar signal to travel down to the surface of the Earth and back to the satellite, and so alters the phase of the signal. Just like sets of ripples meeting in water, the combination of radar signals that have different phases sets up interference patterns – so these combined rainbow-coloured images are known as 'interferograms'.
The resulting interference 'fringes' can be thought of as resembling contour lines, but on vastly reduced scales. Once topographic and atmospheric effects are accounted for, the fringes remaining on an interferogram can be used to precisely measure the extent of any ground shifting over the entire area covered – working like a space-based version of 'spot the difference'.
In this interview, Professor Fialko recounts how he got started with InSAR, explains some of the results it has led to, and shares his ideas for future InSAR-dedicated missions.
How did you come to work as a geophysicist?
Well, I was always interested in the natural sciences. Back in middle school, I was fascinated by the way observations can be explained with elegant mathematical formulae, and I became interested in physics.
However modern-day physics concerns either very small - atomic-scale - or very large - cosmic-scale - objects. Studying geophysics was a way of working on things you can see in everyday life – such as a mountain range, you can work out how these big mountains came to develop.
In fact, where I am right now at Scripps in San Diego is right on a plate boundary, and we can see the results of tectonic uplift out of the window and feel earthquakes on a regular basis.
And unlike in modern theoretical physics, most discoveries in geophysics are still made through observations. Geophysicists learn how the Earth operates through a natural combination of different types of observations with mathematical modelling.
I wrote my Ph. D. on magma fracturing, and realised after learning about Earth Observation that it could tell us a lot about the subject.
What got you interested in applying Earth Observation to your field of study?
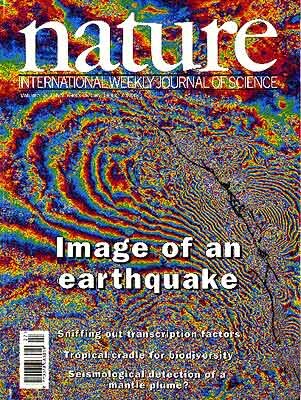
What really started our discussions was an interferogram of the June 1992 Landers earthquake in California that made the front cover of the science journal Nature in July 1993. It was a very beautiful interferogram of the displacement field, based on two radar images from the ESA satellite ERS-1. It made it clear for the first time it was possible to do this kind of analysis using radar satellites.
You were able to immediately interpret the interferogram on the cover?
That's right – the changes in the surface it showed were just what the models would predict. It was very detailed and accurate, and clearly represented a breakthrough in our observational capabilities to learn more about earthquakes. Since then we have been able to make our own interferograms of the same event, revisiting all of the satellite acquisitions, so we have even more detailed information on the pre- and post-seismic deformation that occurred.
It is fortunate that the Landers earthquake happened right at the start of the ERS-1 mission in 1992, so there was a pre-earthquake acquisition followed by many post-earthquakes ones. The initial interferogram shed light on deformation due to the earthquake itself, then after the quake came many more that revealed how the Earth reacted and adjusted in response to this major rupturing event.
Work is still ongoing to learn more about what happened, applying sophisticated models to fully understand the implications from InSAR observations.
Are you interested in earthquakes happening in particular regions?
Since then we have been making interferograms of earthquake events all over the world, as well as just America. Part of the appeal of SAR Interferometry is that the dataset provides truly global coverage, which is really important for earthquake studies because large earthquakes at any given location are quite infrequent. Their repeat time is a hundred years up to a thousand years or more. You can pick a spot to deploy a dense sensor network for monitoring ground deformation, but that is rather ineffective, because you'll wait your entire scientific career for the earthquake to happen to give you a dataset to analyse!
Global satellite observations mean that we are not limited to any point on the ground, so whenever an earthquake happens - and if we have some previous acquisitions - we can immediately analyse the deformation pattern. We always get valuable data that contribute bits and pieces to our understanding of what earthquake ruptures are and how they occur.
What are the alternative ground deformation measuring alternatives to InSAR?
One other very popular geodetic technique is the Global Positioning System (GPS), which involves surveying benchmarks at fixed positions on the ground, acquiring their precise position based on signals from satellites in high orbit. That can provide very accurate measurements of ground displacements down to millimetre scale, although performing such measurements involves either installing permanent GPS stations or repeatedly sending out observers into the field to survey the existing benchmarks.
Levelling is another way of measuring ground deformation, based on elevation changes. Elevation is measured at fixed points and then these measurements are later redone to look for changes up or down.
How does the accuracy compare?
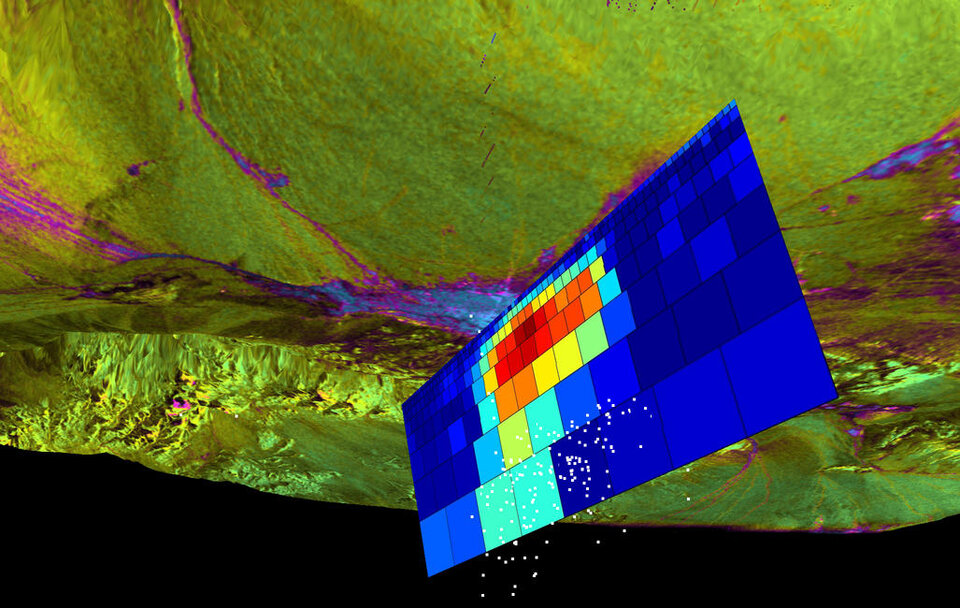
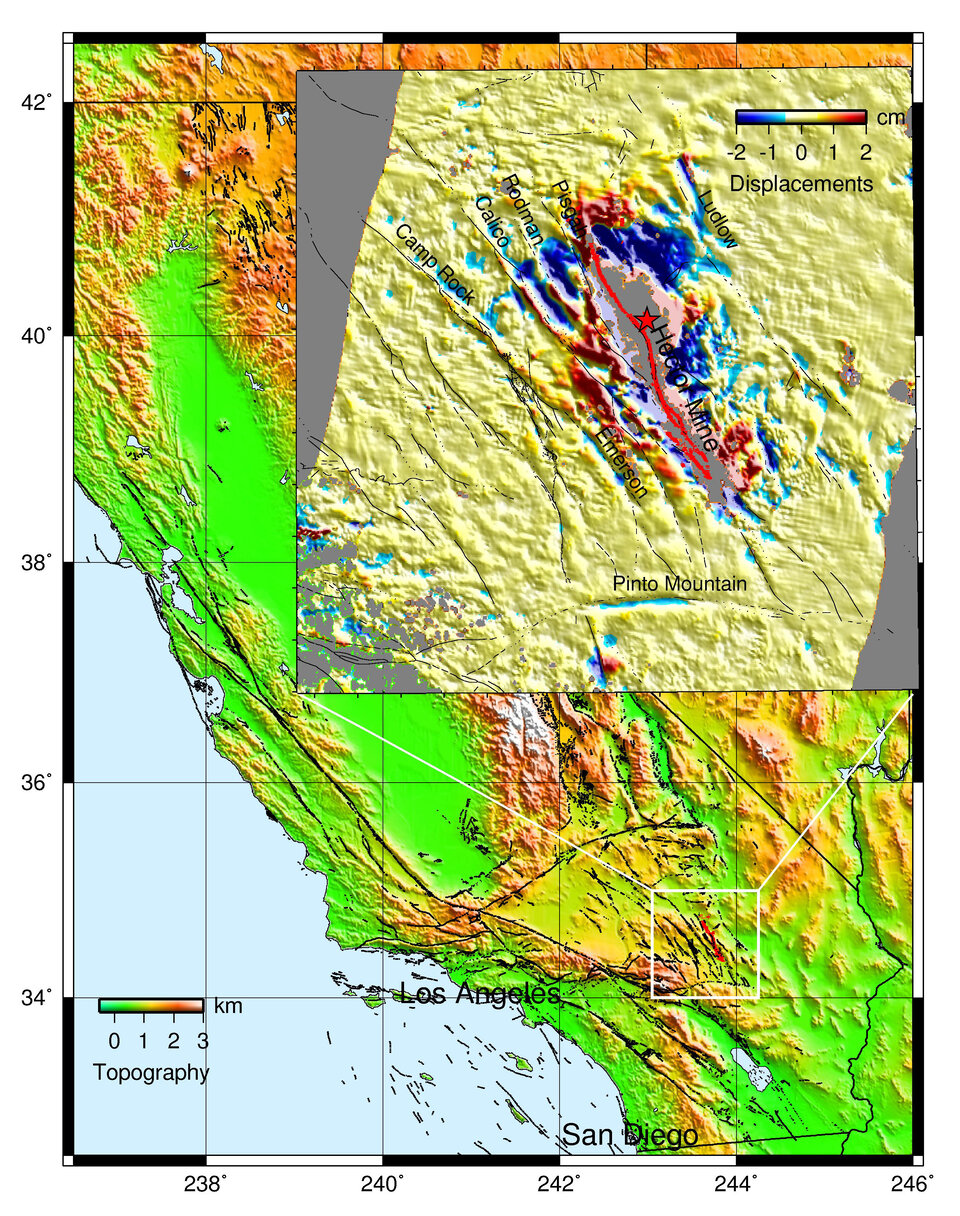
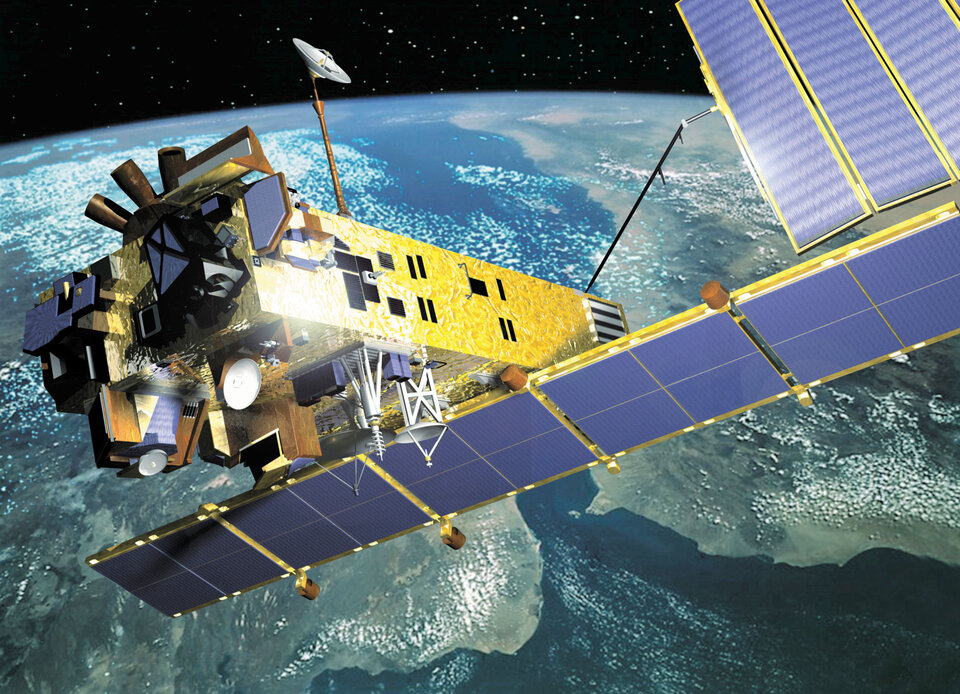
InSAR accuracy is comparable to GPS – millimetre scale – although the latter method measures deformation in all three components of up, down and side-to-side while SAR interferometry only measures one component, which is satellite line of sight. This can be alleviated somewhat by measurements from different lines of sight or using different satellite look angles. ESA's Envisat for example is capable of changing its look angles to get a complete three-dimensional displacement map. This approach has been applied to investigate the aftermath of the 1999 Hector Mine earthquake in the Mojave Desert and the 2003 earthquake in Bam, Iran, both of which were around the same magnitude but the latter killing 30,000 people.
SAR Interferometry also gives a continuous and detailed picture of deformation occurring all across an earthquake zone while with GPS it all depends on how dense your GPS network is.
GPS and InSAR are actually very complementary because orbital dynamics is such that it takes at least 35 days for a SAR satellite to revisit a site of interest - and a temporal gap might be up to a few years if the acquisition scheduling is not favorable. The permanent GPS technique can be as frequent as you like - down to one second, or even less - so the two methods can be readily combined to maximise temporal and spatial coverage.
Have any surprises come out of your use of InSAR?
The information that has been extracted from InSAR shows us that places where earthquakes happen are not just sharp cuts through the Earth’s crust, they are characterized by finite layers of crushed material with mechanical properties that are quite distinctive. In essence the material from which these layers are made is much more compliant – more 'squishy' – than the surrounding rock.
This difference in the properties of the material has been identified by looking at a map of surface strain provided by InSAR – it was not fully appreciated previously that these zones are quite pervasive and ubiquitous. Without InSAR, all the squeeze and shear that was taking place on the fault zones would have gone unnoticed.

Another example is in looking at the readjustments of the Earth’s crust following earthquakes. There is a big argument over the underlying physical mechanisms that drive these readjustments, and InSAR is bringing in very useful and important constraints as to what they are. Our study of the post Landers deformation shows that the relaxation of strain is due to several mechanisms, most likely involving some localized shear on a deep 'root' of the earthquake fault - allowing the lower crust to catch up with the upper brittle layer - and slow percolation of pore fluids in the upper crust from areas that have been squeezed by the earthquake into areas of relative extension, similar to the way water is squeezed from a sponge.
You have also applied InSAR to other geophysical phenomena?
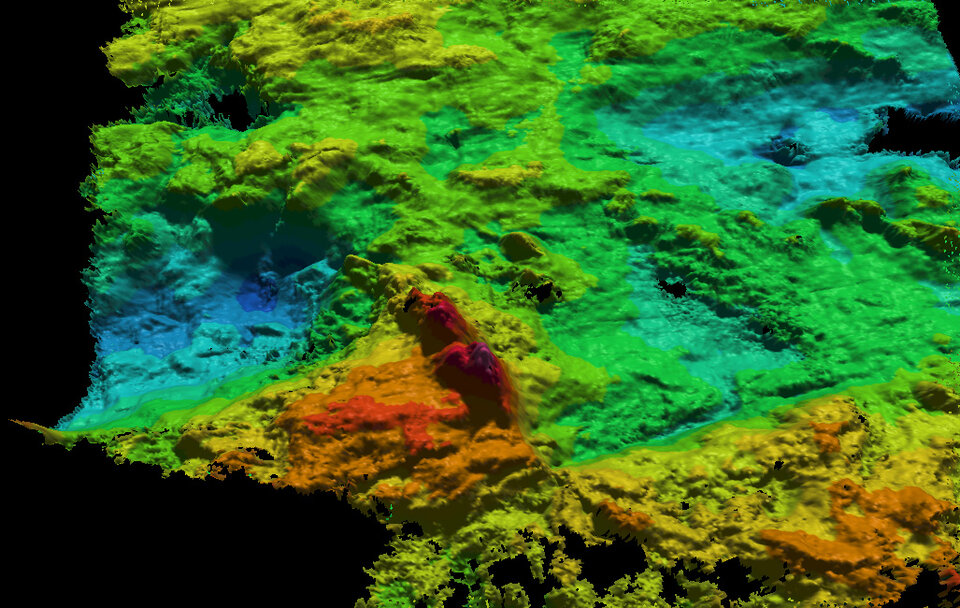
We have also used the technique to study volcanic activity; in particular, a fascinating object called the Socorro magma body in New Mexico. It is basically a little ocean of magma just below our feet right in the middle of the continent. To give an idea of scale it is located about 19 km down, and measures about 80 km by 50 km across; its thickness is not well constrained but could be anything from 100 m up to a few km. This is one of the largest if not the largest currently-known magma bodies in the continental United States. It is also centred on the Rio Grande rift which is one of four currently active continental rifts in the world at the moment.
There is an argument about its origin – it could be a land-based analogue of a Hawaiian hotspot, or a just a very big blob of magma intruding into the crust from a yet unknown source.
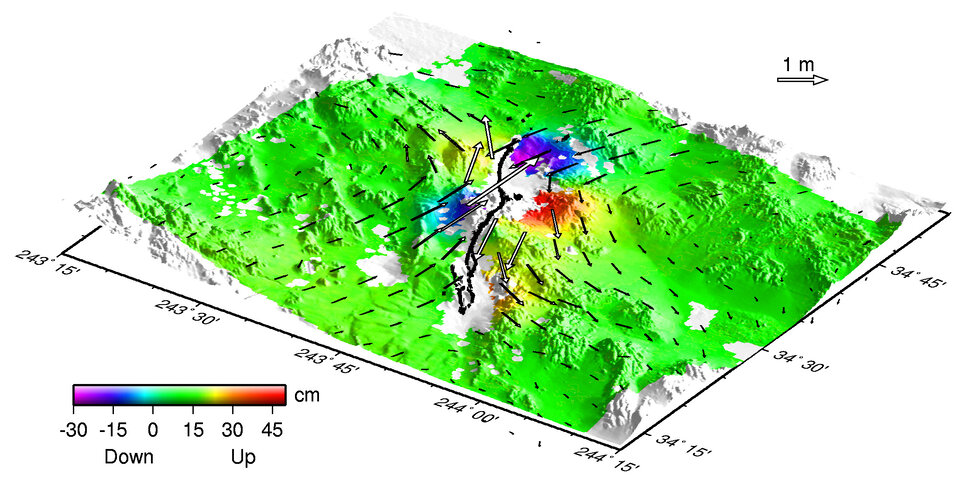
It was first discovered in the 1960s based on seismic studies, as a very strong reflector of seismic energy. The inferred depth of nearly 20 km indicated magma as the most likely source. Geodetic measurements around that time based on levelling showed a very broad but small uplift associated with this unusual reflector of about 2-3 mm a year. Our own subsequent InSAR measurements came to exactly that same figure, and this to me suggests an ongoing uplift normally associated with the infiltration of a magma body, suggesting this is a very active volcanic province. The implication is that at some time that magma may find its way to the surface. Magma is a very mobile thing, and when it accumulates it can surprise!
You are also involved with WInNSAR?
The Western North America Synthetic Aperture Radar Interferometric Synthethic Aperture Radar Consortium (WInSAR) is a group of research institutions in the United States that use InSAR data. With a common interest in certain areas it makes sense to carry out a centralised ordering of data with distributors – which in this case means ESA. The ultimate goals of WInSAR are to facilitate access to InSAR data for researchers who are actively involved in Earth Observations, promote the use of data within the broader science community, and stimulate collaborations and sharing of scientific results between different research groups. We have a number of active and creative scientists who are interested in all kinds of subjects ranging from hydrology and flood dynamics through to earthquakes, volcanoes and tectonics, and are all using the very exciting datasets Envisat and ERS are giving us.
With this interest, is a future US InSAR mission a possibility?
There is great interest in the science community regarding a dedicated SAR mission, and there is a general support from NASA and funding agencies such as the National Science Foundation (NSF) and United States Geological Survey (USGS). It is a lengthy process so we are moving it along with various workshops and conferences to discuss requirements for such a mission.
Shorter revisit times of the order of a week to ten days – possibly with multiple sensors in orbit - would help greatly with data correlation for certain areas on the ground where right now it is a problem. Current InSAR systems work great for deserts, urban areas and other sites with stable reflective properties, but thick vegetation makes the creation of interferograms hard if not impossible because of penetration and surface stability problems between acquisitions.
Another way around these problems is to go to longer wavelengths, up from the current 'C-band' 6-cm wavelength up to the 25-cm 'L-band', which would increase correlation dramatically because small-scale scatterers such as tree branches or thick grass would no longer be a prohibitive factor for interferometry.
And for geodynamics especially, the ability to have an increased number of look angles would allow us to resolve deformation in a more three-dimensional way. This is important now because our models are sophisticated enough that very slight differences in observed deformation patterns may enable us to distinguish different mechanisms of crustal movements.