Italy’s Po River seen thinning from orbit
The seven-week heatwave that has left Italy facing drought and looming black-outs has also changed its landscape in a way visible from space, seen by comparing radar images of the Po Valley acquired by ESA’s ERS-2 in June and July.
ERS-2 imaged a section of the lower reaches of the Po River 50km south of Venice, on 30 June at 9.20pm local time, then revisited the same spot at the same time on 19 July, to reveal some significant changes.
The Po - Italy’s longest river - has its level reduced to its lowest point in a century, dropping more than seven metres below normal and reducing to a trickle at some points.
In turn this is impacting water supplies available for electricity production and irrigation. Some power plants are being forced to operate below capacity due to insufficient water for cooling. The Porto Tolle plant near Venice supplies 5% of all Italy’s power but is currently producing only 50% normal power.
This comes at a time when the demand for electricity is soaring as overheated citizens crank up air conditioning units, and power producers have already had to resort to rolling blackouts to maintain the system, along with hundreds of megawatts of imported French electricity.
Farmers’ organisations in Piedmont, Lombardy, Emilia Romagna and Venice have called on the government to declare a state of emergency along the Po Valley. Irrigation-dependent corn, beet, fodder, soyabeans, rice and vegetable crops are all under threat. Recent storms and hail in the north gave farmers little relief, as the dry soil was unable to retain much water.
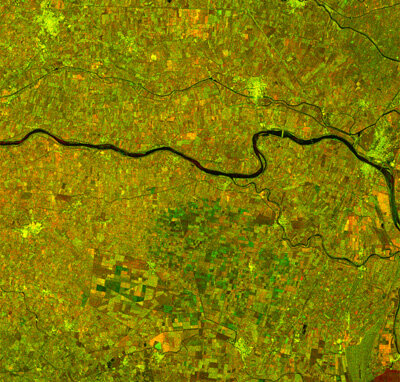
ERS-2 Synthetic Aperture Radar (SAR) images show up water surfaces very well: water bodies such as rivers tend to be very flat so radar bounces off them rather than scatters. This means signal return is very low, represented in the image by dark pixels. So the Po appears a clear black line in both these images, but its course has visibly thinned in the latter image.
Combining the data of the two images together to create what is called a multitemporal image highlights the changes. Where the data input is similar for the two images a yellow-light green is produced. Where red is dominant denotes greater signal return for the June image, and in turn green for the July image.
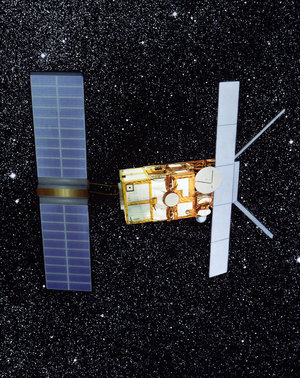
ERS-2
Completing an orbit of the Earth about once every 100 minutes from 800km up, ESA’s ERS-2 was launched back in 1995. Its instruments include an advanced Synthetic Aperture Radar (SAR) that can see through clouds and darkness.
For a while ERS-2 operated in tandem with its predecessor ERS-1, which was finally turned off in 1999. Now ERS-2 flies together with Envisat, ESA’s newest and most advanced environmental satellite.
During twelve years of operation, data from the ERS series have served a variety of uses, from agricultural monitoring to climate change research to disaster relief.