Ice thickness
Ice – a climate change indicator
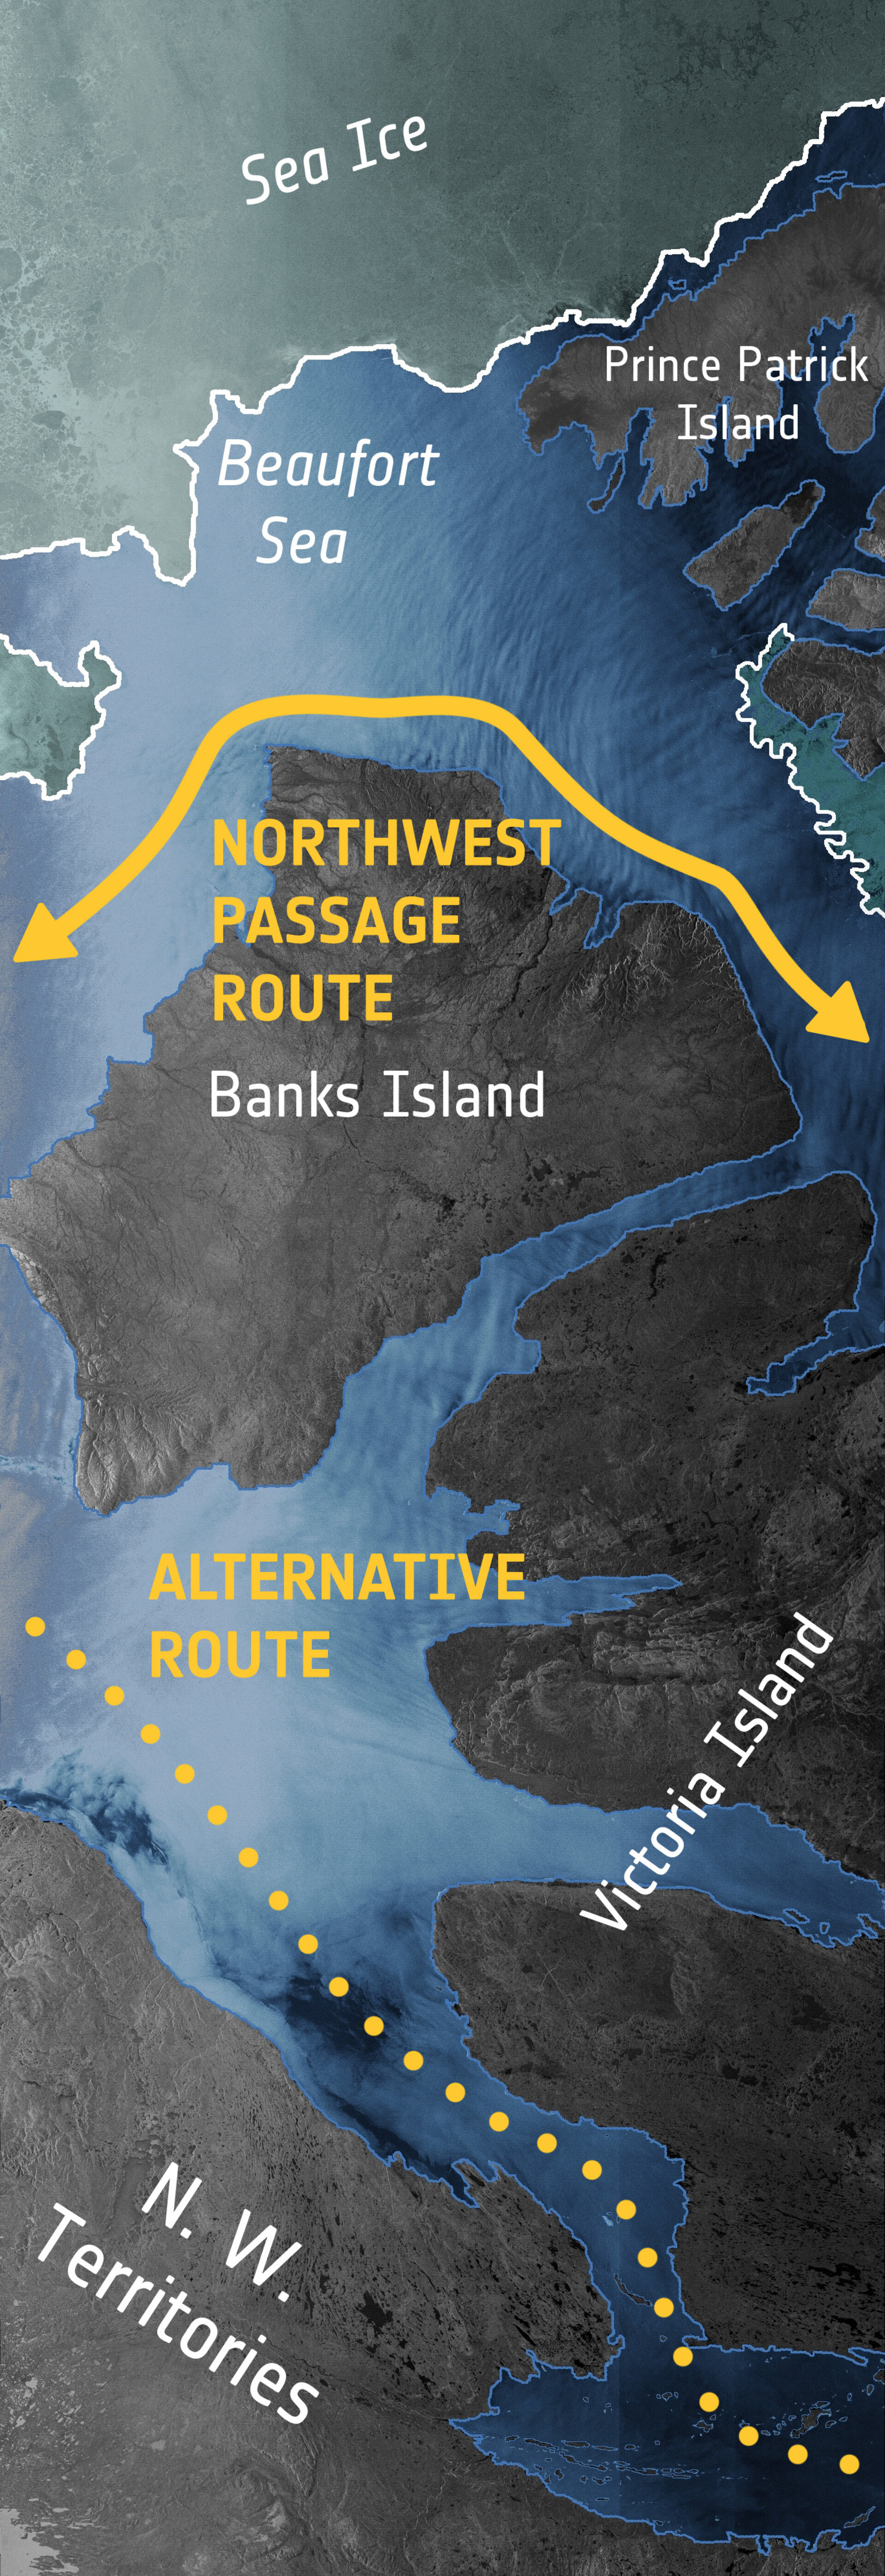
Scientists use satellite radar data to analyse changes and movements of sea ice. In August 2007, data from satellites including Envisat was used by scientists to determine that sea ice in the Arctic had hit a record low. 2011 was another year of below-average ice coverage, and Envisat imagery showed that Arctic shipping shortcuts were ice-free.

Petermann Glacier
In August 2010, Envisat observed a rare event in the Arctic - a giant iceberg breaking off the Petermann glacier in North-West Greenland. The Petermann glacier is one of the largest glaciers connecting the Greenland inland ice sheet with the Arctic Ocean. Upon reaching the sea, a number of these large outlet glaciers extend into the water with a floating 'ice tongue'. In an Envisat radar image taken on 3 August, the ice tongue was still intact but, on 4 August, a large part of the floating ice tongue was separated from the glacier, giving birth to what was the largest iceberg in the northern hemisphere at that time. The radar imaging system used by Envisat and other satellites is particularly suited to observe polar areas, as it can acquire images through cloud or fog, and night and day.

Ice velocity map
In August 2011, the first map of ice velocity over the entire continent of Antarctica was created derived from, Envisat ASAR, ALOS PALSAR, Radarsat-2, ERS-1 and ERS-2 satellite radar interferometry overlaid on a MODIS mosaic of Antarctica. These new findings are critical to measuring the global impact to sea-level rise resulting from ice flowing into the ocean.