Satellites show how Earth moved during Italy quake
Studying satellite radar data from ESA’s Envisat and the Italian Space Agency’s COSMO-SkyMed, scientists have begun analysing the movement of Earth during and after the 6.3 earthquake that shook the medieval town of L’Aquila in central Italy on 6 April 2009.
Scientists from Italy’s Istituto per il Rilevamento Elettromagnetico dell’ Ambiente (IREA-CNR) and the Istituto Nazionale di Geofisica e Vulcanologia (INGV) are studying Synthetic Aperture Radar (SAR) data from these satellites to map surface deformations after the earthquake and the numerous aftershocks that have followed.
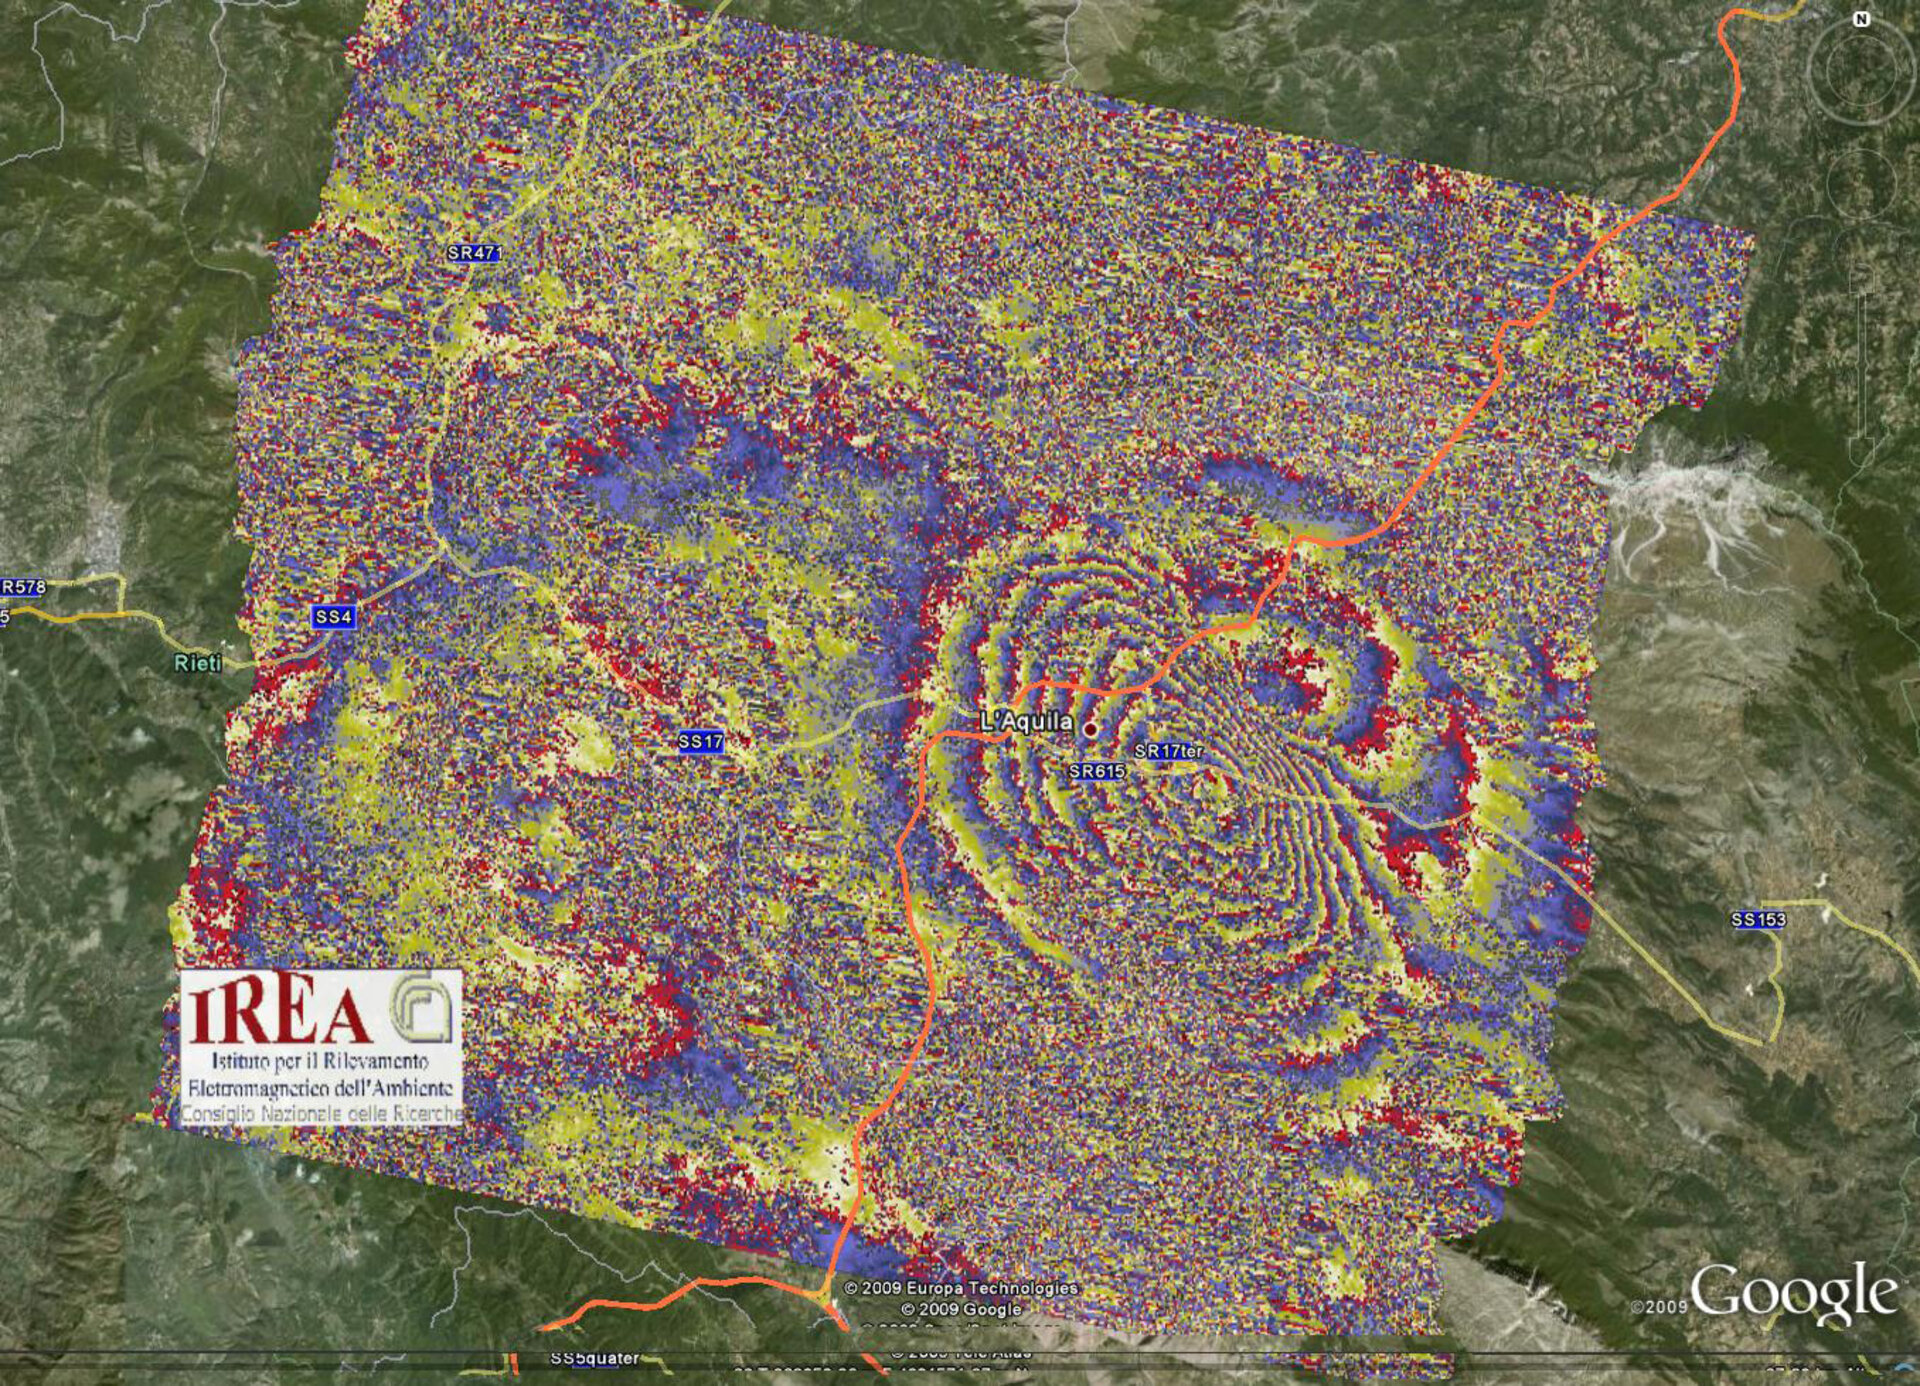
The scientists are using a technique known as SAR Interferometry (InSAR), a sophisticated version of 'spot the difference'. InSAR involves combining two or more radar images of the same ground location in such a way that very precise measurements – down to a scale of a few millimetres – can be made of any ground motion taking place between image acquisitions.
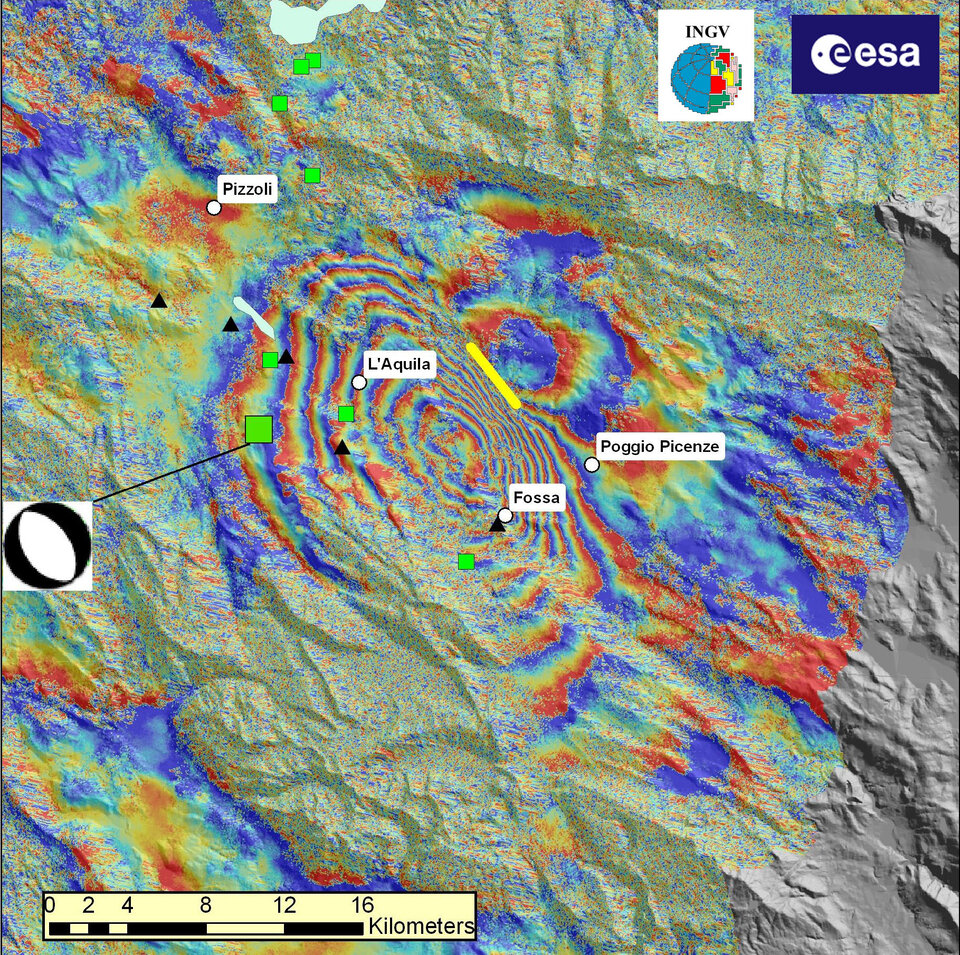
The InSAR technique merges data acquired before and after the earthquake to generate 'interferogram' images that appear as rainbow-coloured interference patterns. A complete set of coloured bands, called ‘fringes’, represents ground movement relative to the spacecraft of half a wavelength, which is 2.8 cm in the case of Envisat's ASAR.
The first Envisat data, acquired after the earthquake on 12 April, were made immediately available to the scientists.

"We produced an interferogram just a few hours after the Envisat acquisition by combining these data with data acquired before the earthquake on 1 February. We were pleased that we were able to immediately see the pattern of the earthquake," said Riccardo Lanari of IREA-CNR in Naples, Italy.
The Envisat interferogram, as explained by Stefano Salvi from INGV’s Earthquake Remote Sensing Group, shows nine fringes surrounding a maximum displacement area located midway between L’Aquila and Fossa, where the ground moved as much as 25 cm (along a line between the satellite’s orbital position and the earthquake area).
"By using available 3D ground displacements from five GPS location sites around the affected area, we were able to confirm the preliminary results obtained with Envisat data," Salvi said.

The COSMO-SkyMed constellation, which is currently made up of three satellites, allows for frequent data. This means new interferograms can be calculated every few days.
The COSMO-SkyMed data together with the Envisat data and possibly SAR data from other satellites will ensure a dense sampling of the ground deformation around the L’Aquila area in the next months, which could make this earthquake one of the most covered by SAR Interferometry measurements.
To ensure all scientists are able to contribute to the analysis of the earthquake, ESA is making its Earth observation dataset collected over the L’Aquila area freely accessible with an innovative fast data download mechanism. The dataset will be continuously updated with the newest Envisat acquisitions.