Ice matters
The satellite age has revolutionised our understanding of Earth, giving us accurate information to help critical agreements on climate change such as at the current COP21 conference in Paris. Diminishing polar ice is one of the most visible indicators of change, but how much have we learnt over the last decades?
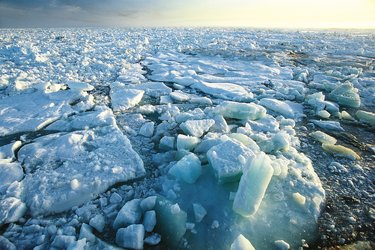
Spectacular feats of polar exploration actually go back to the 1800’s when early expeditions offered a rare glimpse into these icy regions. However, it is only relatively recently that we have understood the importance of ice in the climate system and have evidence that these frozen expanses are becoming a casualty of climate change.
Arctic sea ice, for example, is particularly sensitive to our warming climate and is often cited as a barometer of global change.
Ice that forms and melts in the ocean only has a very tiny effect on sea level – the melting of ice sheets and glaciers that overlie land are the main causes of sea-level rise, along with the thermal expansion of the water.
However, sea ice does affect how much sunlight is reflected back out to space, it affects global heat transport by insulating the relatively warm ocean from the cold polar atmosphere, and it significantly influences ocean circulation patterns, which play a role in our global climate system.
Because of the remoteness, extreme cold and hostile conditions of the Arctic, it is impossible to acquire frequent all-weather measurements any other way than from space.
Each year, the polar oceans experience the formation and then melting of vast amounts of sea ice. Around the North Pole, an area roughly the size of Europe melts every summer and then freezes again the following year.
Scientists have been using radar measurements from satellites such as ERS-1, ERS-2 and Envisat for more than 25 years to study this seasonal change in ice extent. They have found that since 2000 the area of the Arctic Ocean covered by ice in the summer has reduced drastically.
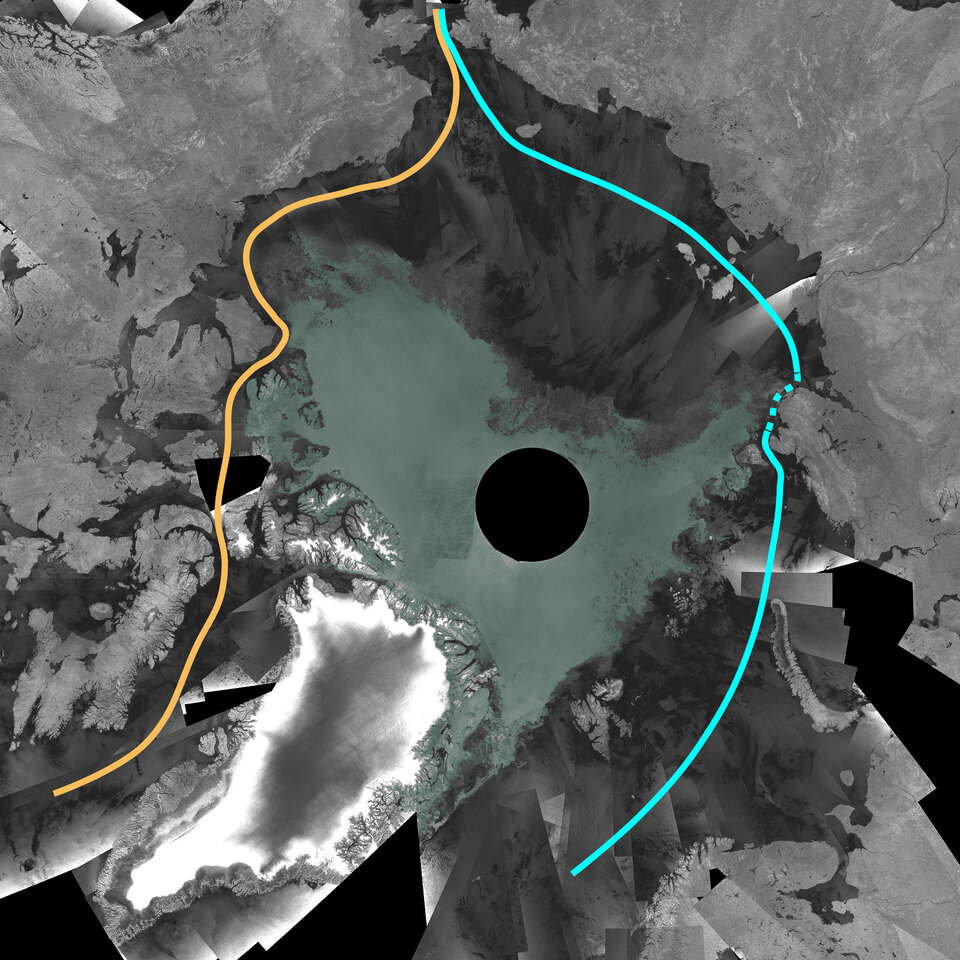
For example, in September 2007, it was discovered that the sea ice had shrunk to its lowest level since satellite measurements began, opening up the Northwest Passage, a long-sought shortcut between Europe and Asia that had been historically impassable.
The extent of ice reached the lowest on record in September 2012.
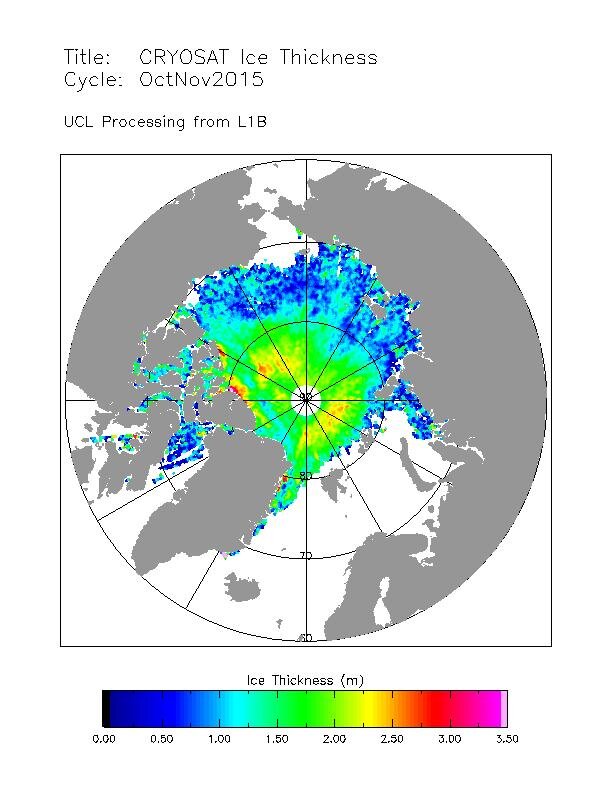
However, the area of the ocean covered by ice is only part of the story. It is also essential to have measurements of the thickness of the ice to work out how the actual volume is changing.
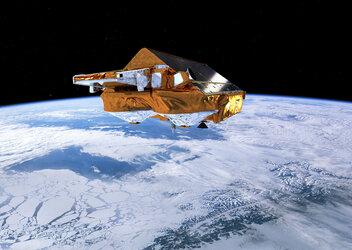
Launched in 2010, ESA’s CryoSat satellite has shed new light on diminishing polar ice.
ESA’s CryoSat mission manager, Tommaso Parrinello, said, “By measuring the height of the ice, both of that floating in the polar oceans and of the vast ice sheets covering Greenland and Antarctica, CryoSat is providing essential information on how the ice thickness is changing.

Access the video
“It was difficult to assess the volume of Arctic sea ice before CryoSat. For example, we now know that between 2010 and 2012 the volume of summer sea ice decreased by around 10%.
“Measurements made during October and November 2014 showed that the volume stood at about 10 300 cubic kilometres, a small drop compared to 2013’s 10 900 cubic kilometres.”
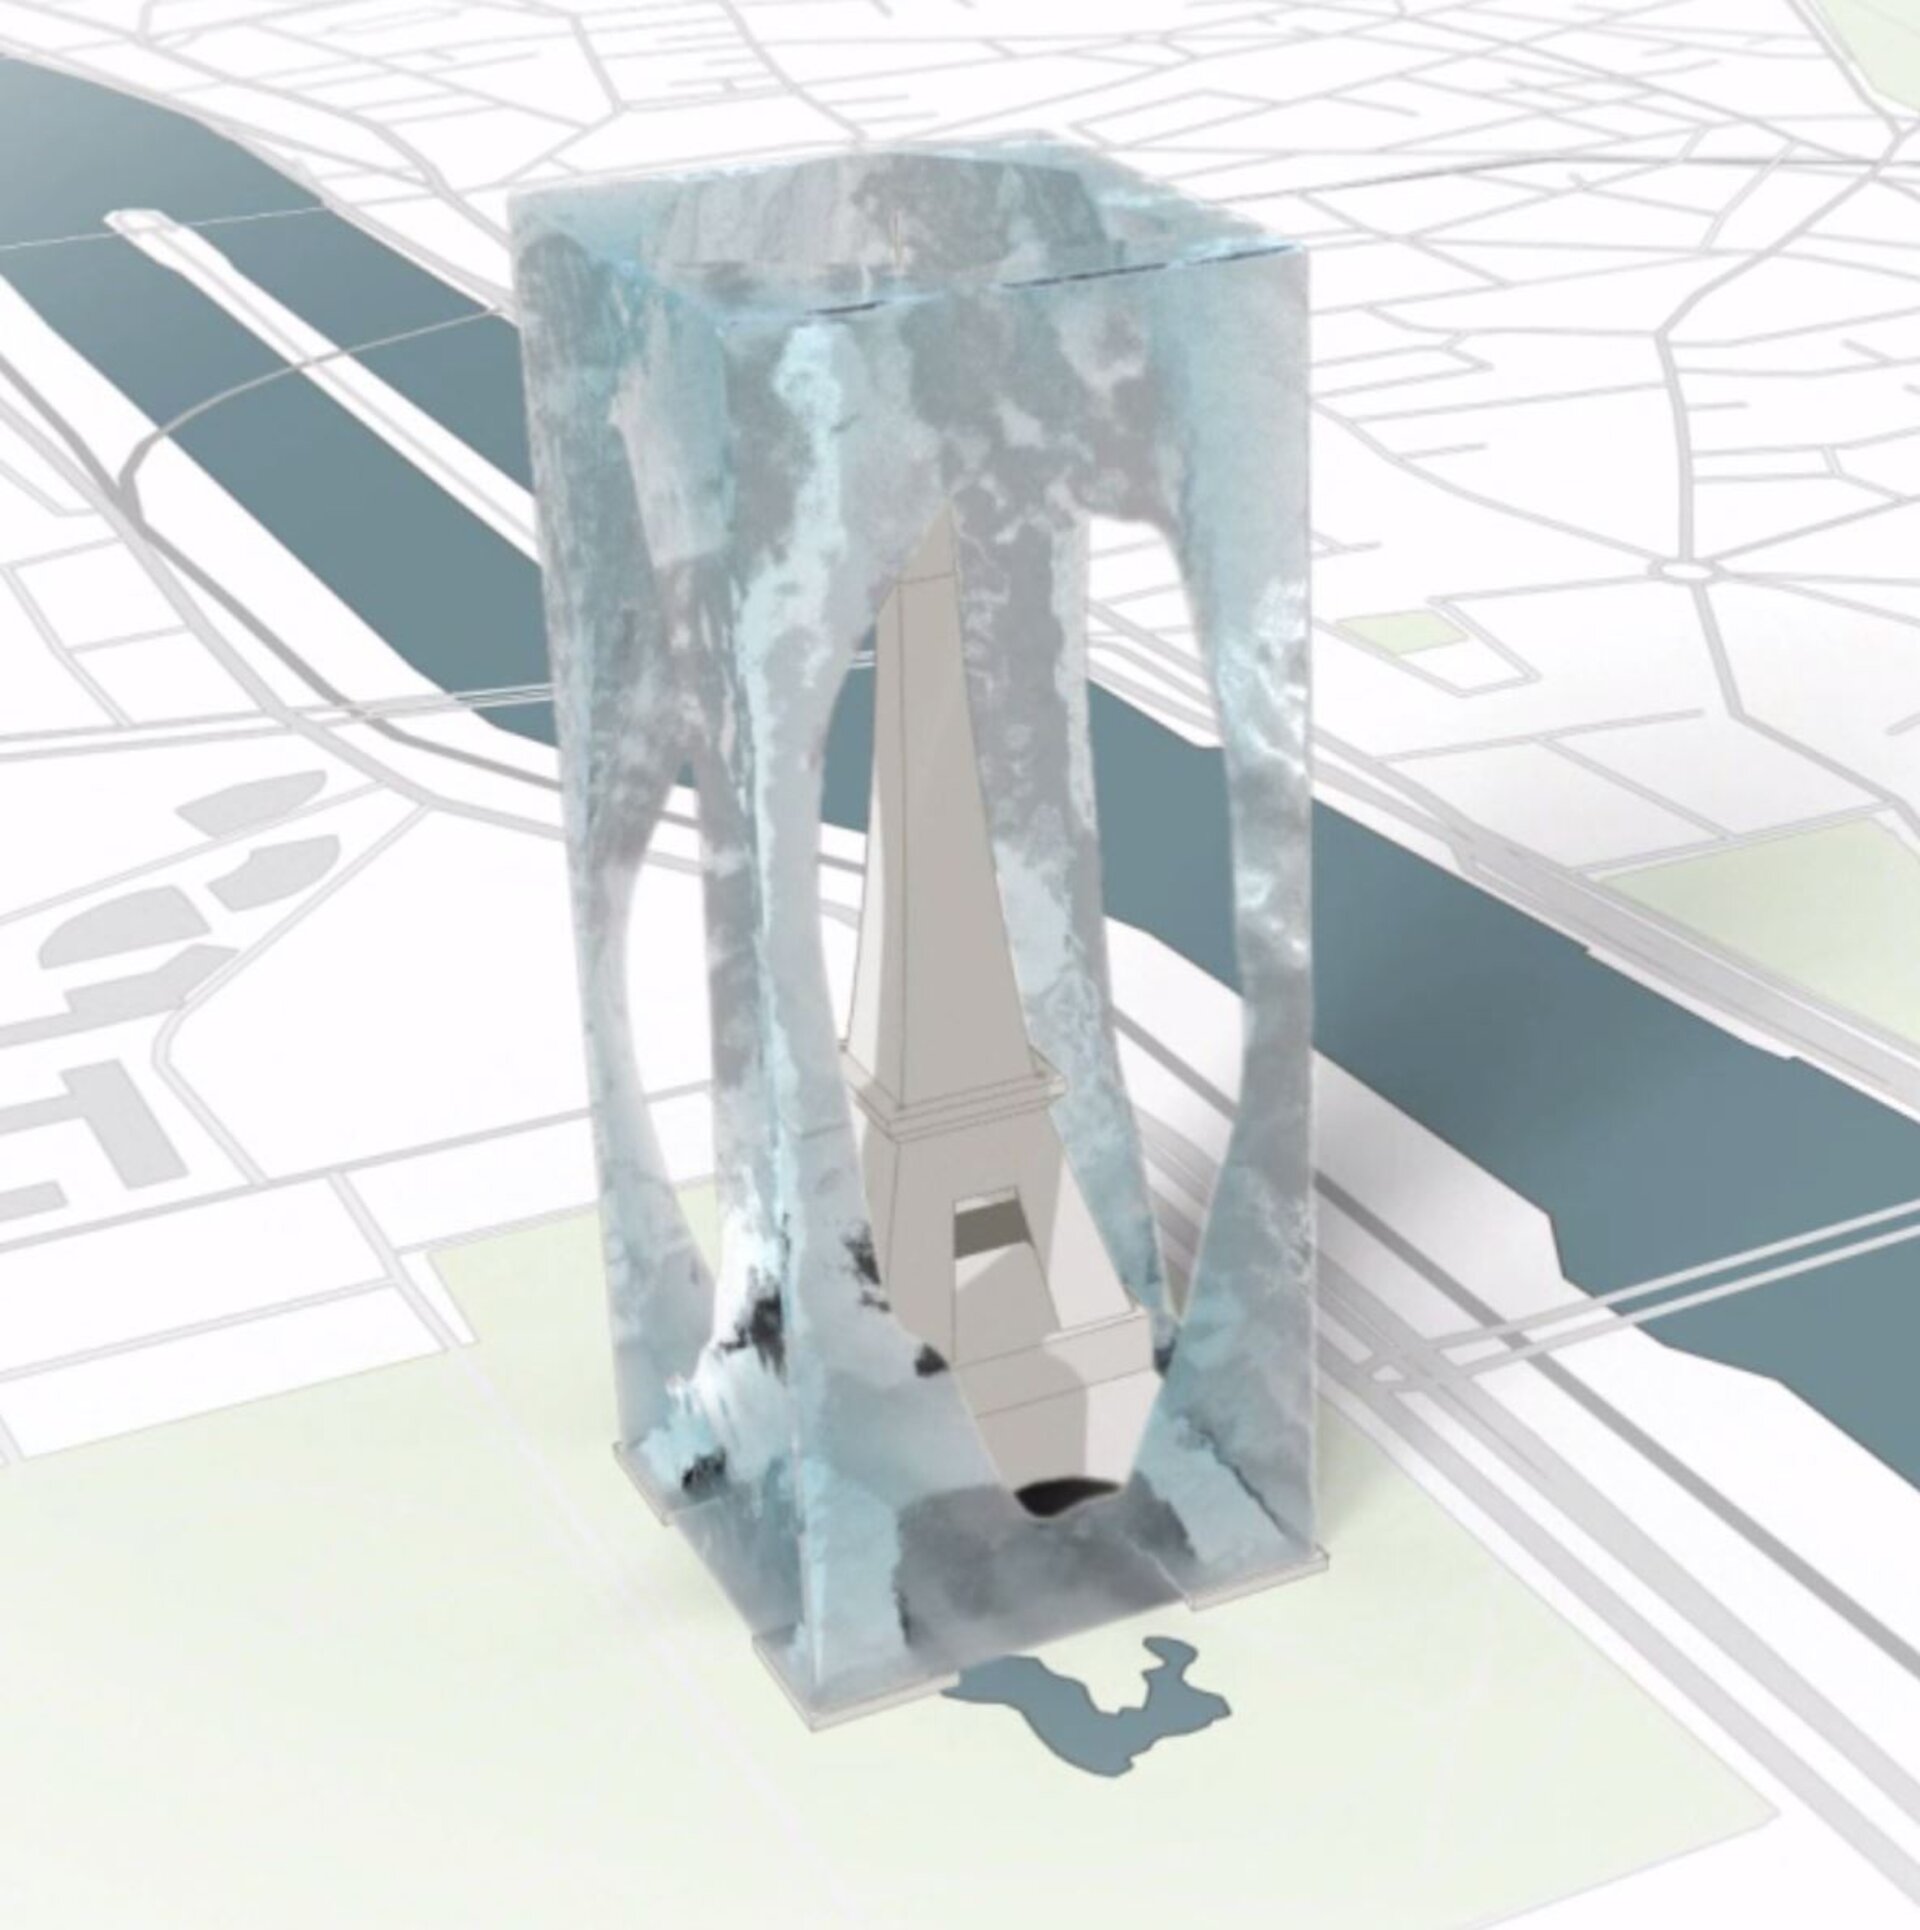
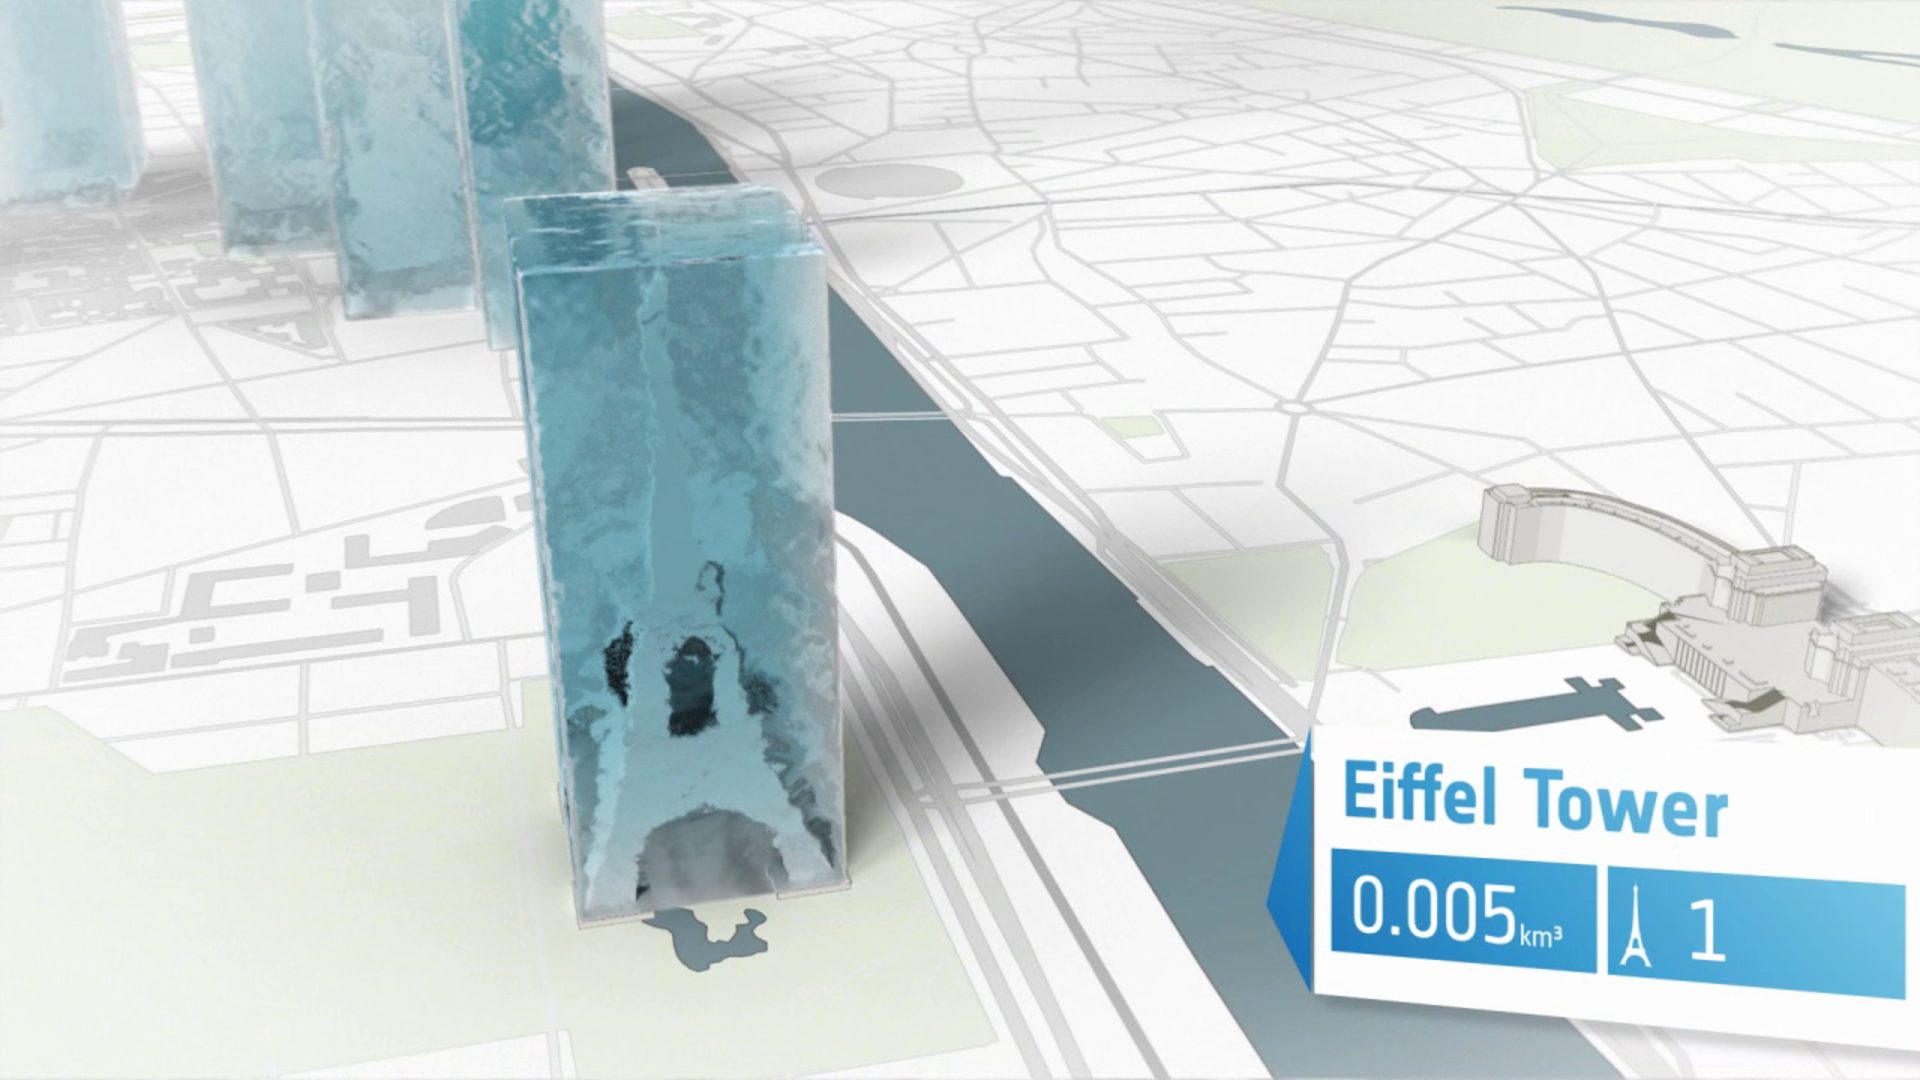
With the Paris COP21 meeting at the forefront of climate discussions, the animation gives an idea of how much ice there was floating in the Arctic in October this year, in terms of ice cubes the size of the Eiffel Tower.
It would take 0.005 cubic kilometre of ice to encase one Eiffel Tower, 1 cubic kilometre would encase 192 Eiffel Towers and, hence, 8000 cubic kilometres of ice to encase 1.7 million towers. This is roughly about the same volume of ice that was floating in the Arctic Ocean at the beginning of November 2015.