OECD uses ESA data to measure green growth
ESA data have been used to develop the new Organisation for Economic Co-operation and Development Green Growth headline indicator on land-cover change.
The Organisation for Economic Co-operation and Development (OECD) defines green growth as ‘fostering economic growth and development, while ensuring that natural assets continue to provide the resources and environmental services on which our well-being relies.’
As loss of biodiversity and increased pressures on ecosystem services continue to pose challenges globally, it is becoming increasingly important to monitor land-cover change in the context of green growth. This is the message of a recent OECD publication.
The report on monitoring land-cover change, seeks to shine a spotlight on the importance of land-cover change as ‘the best measure available to monitor pressures on terrestrial ecosystems and biodiversity.’
One of the key ways in which OECD recommends doing this is through the use of its new green growth headline indicator, which is based on ESA data from the Climate Change Initiative (CCI) and Cover project.
ESA’s CCI provides the science community and governing bodies with vital Earth observation datasets to understand and help mitigate climate change. These robust, long-term, global satellite datasets are also required by the Global Climate Observing System.
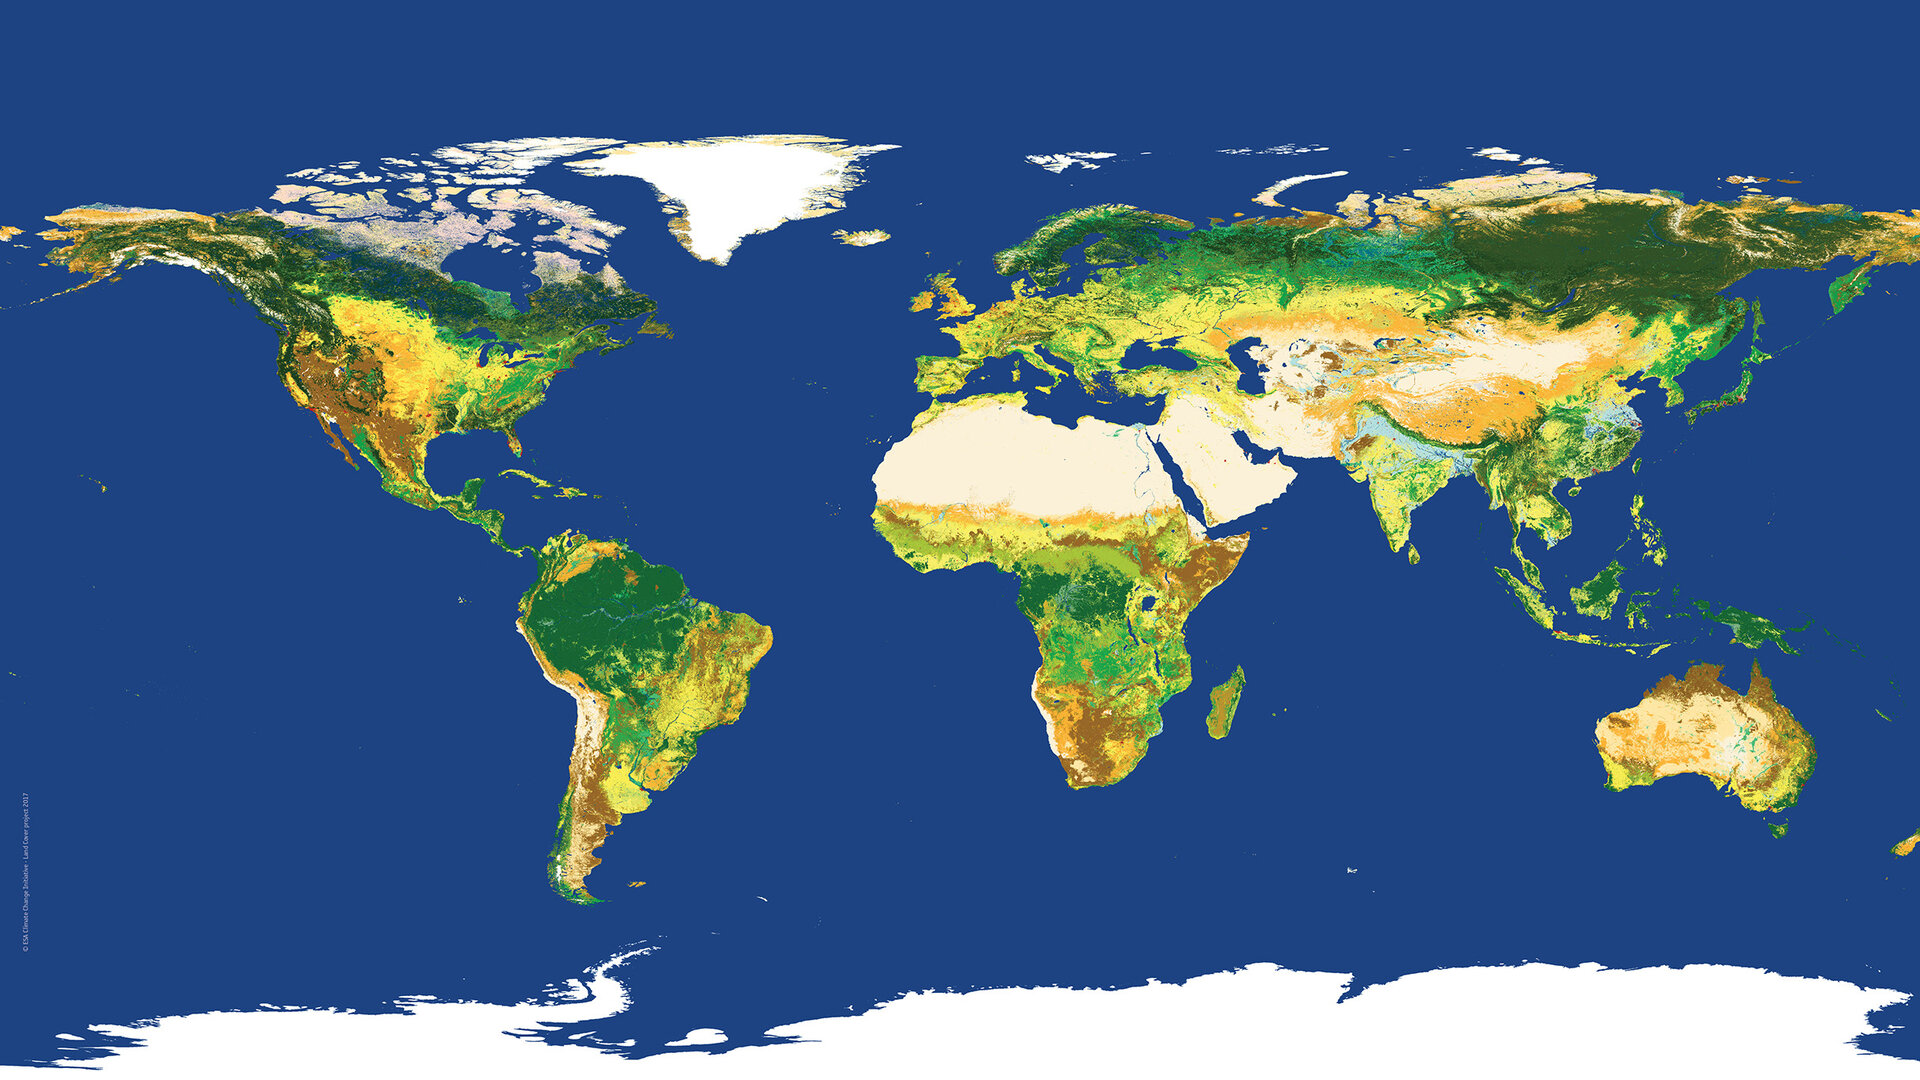
The datasets used to develop the new OECD indicator provide information on changes in types of land cover.
The science lead for the CCI Land Cover time series, Pierre Defourny, from the Université catholique de Louvain in Belgium, says that they aim to provide a harmonised, stable and consistent account of long-term land-cover status and changes that is ‘immune’ to short-term seasonal and temporary changes like snow cover in winter and crop rotation.
“In its current edition, the headline indicator distinguishes nine broad land-cover classes: tree cover, grassland, wetland, shrubland, sparse vegetation, as well as cropland, bare land, inland water and artificial surfaces,” explains Ivan Haščič, a senior economist at OECD.
“It seeks to measure changes from more natural to more anthropogenic land-cover types. This is because at the global scale, natural vegetated areas are critical for the conservation of biodiversity and the provision of ecosystem services.”
Agricultural expansion and urbanisation are among the biggest drivers of land-cover change.
ESA started working on global land-cover with the launch of the Envisat satellite mission, producing first GlobCover2005 and then GlobCover2009, under the GlobCover initiative.
Started in 2005 in partnership with JRC, EEA, FAO, UNEP, GOFC-GOLD and IGBP, the initiative aimed to develop a service capable of delivering global composites and land-cover maps using observations from the 300 m resolution MERIS sensor on Envisat.
“The annual global land-cover maps span a 24-year period, from 1992 to 2015,” says ESA’s Olivier Arino. “It is great to see international organisations like OECD using ESA data to help to tackle major global issues, which can also potentially be used to support countries in their efforts to measure progress towards international targets, such as the United Nations Sustainable Development Goals.”
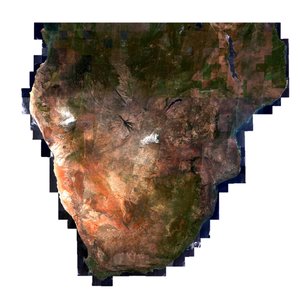
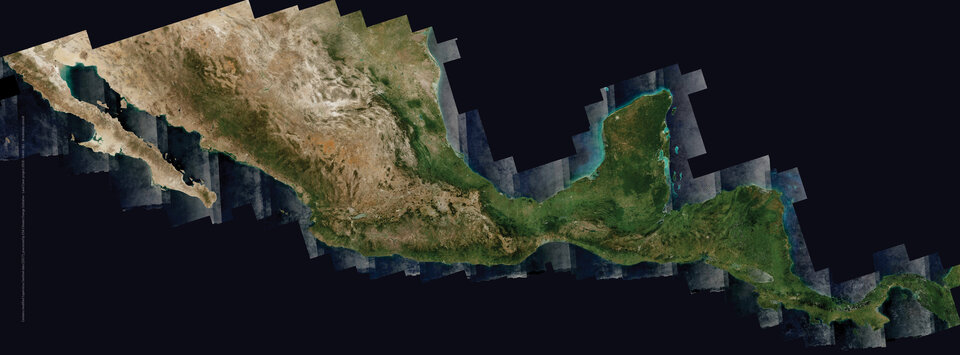
More recently, the same CCI Land Cover team has also demonstrated the performance of the Copernicus Sentinel-2 mission to deliver 10 m resolution land-cover maps over very large areas, such as Africa and Central America.