
Putting renewable energy on the map
With the rising demand for renewable energy as one of the key means to keep the current trends in climate change at bay comes the difficulty of choosing suitable sites for wind and solar energy farms. Finding the optimal location for a renewable energy plant is both a question of finding a sufficiently large resource, of knowing the uncertainty of the resource estimate, and of mapping the constraints for each technology.

Thanks to the Global Solar Atlas (GSA) and the recently launched Global Wind Atlas (GWA), choosing the optimal site for renewable energy farms has become much easier. Both atlases are free, web-based tools created in the framework of an ESMAP (Energy Sector Management Assistance Program) funded initiative on Renewable Energy Resource Mapping. The Technical University of Denmark (DTU) and the World Bank cooperated with the wind data processing company Vortex to create the GWA.
How does it work?
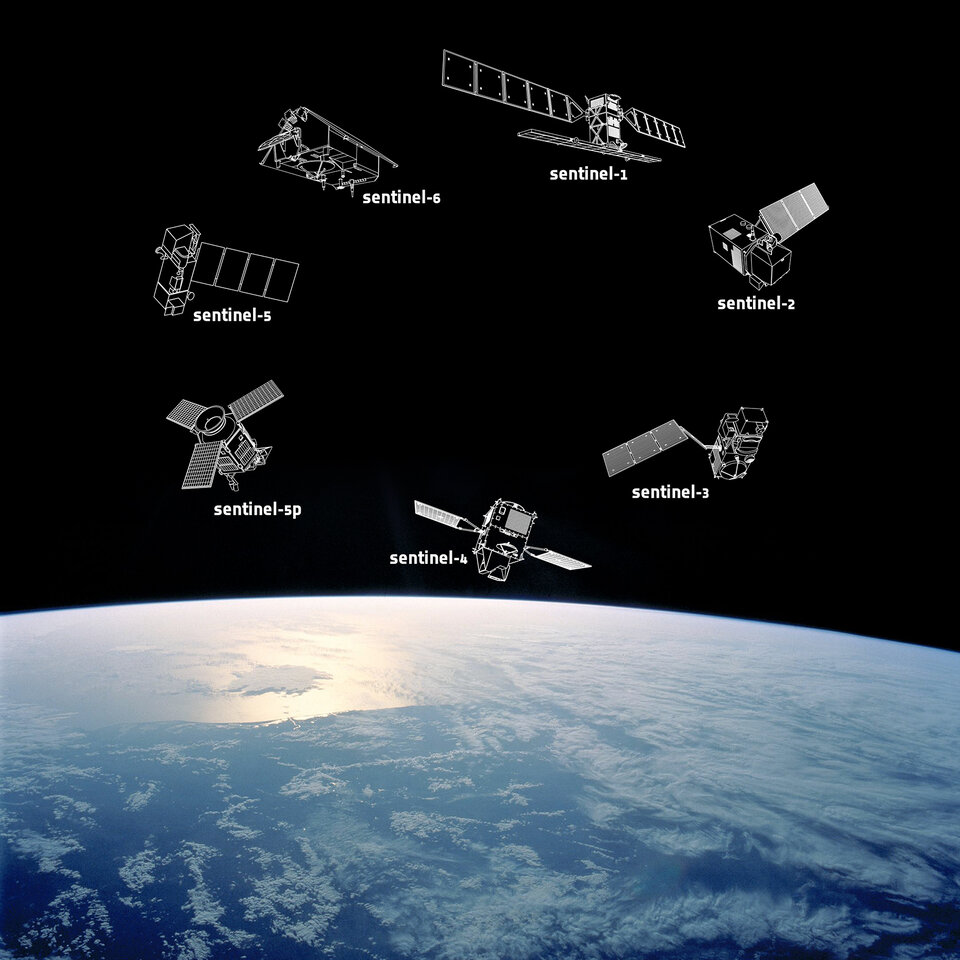
Global weather research institutes in Europe and the United States collect weather data from different sources, such as satellites, weather balloons, and ground measurement stations. This historical weather information is then downloaded and combined with global topographical data and satellite-based land cover data and used as inputs for global weather "hindcasting".
Vortex, an expert in this field, processed the data for the Global Wind Atlas running the global WRF weather forecasting model for months on end on a supercomputer cluster to provide weather data for millions of 9x9 km areas covering the entire globe. Subsequently, DTU used its own models to analyse local terrain influences on wind speeds and wind directions in 1-km space grids for each of three heights above ground level. The output is about 150 million local wind resource estimates.
What does it look like?
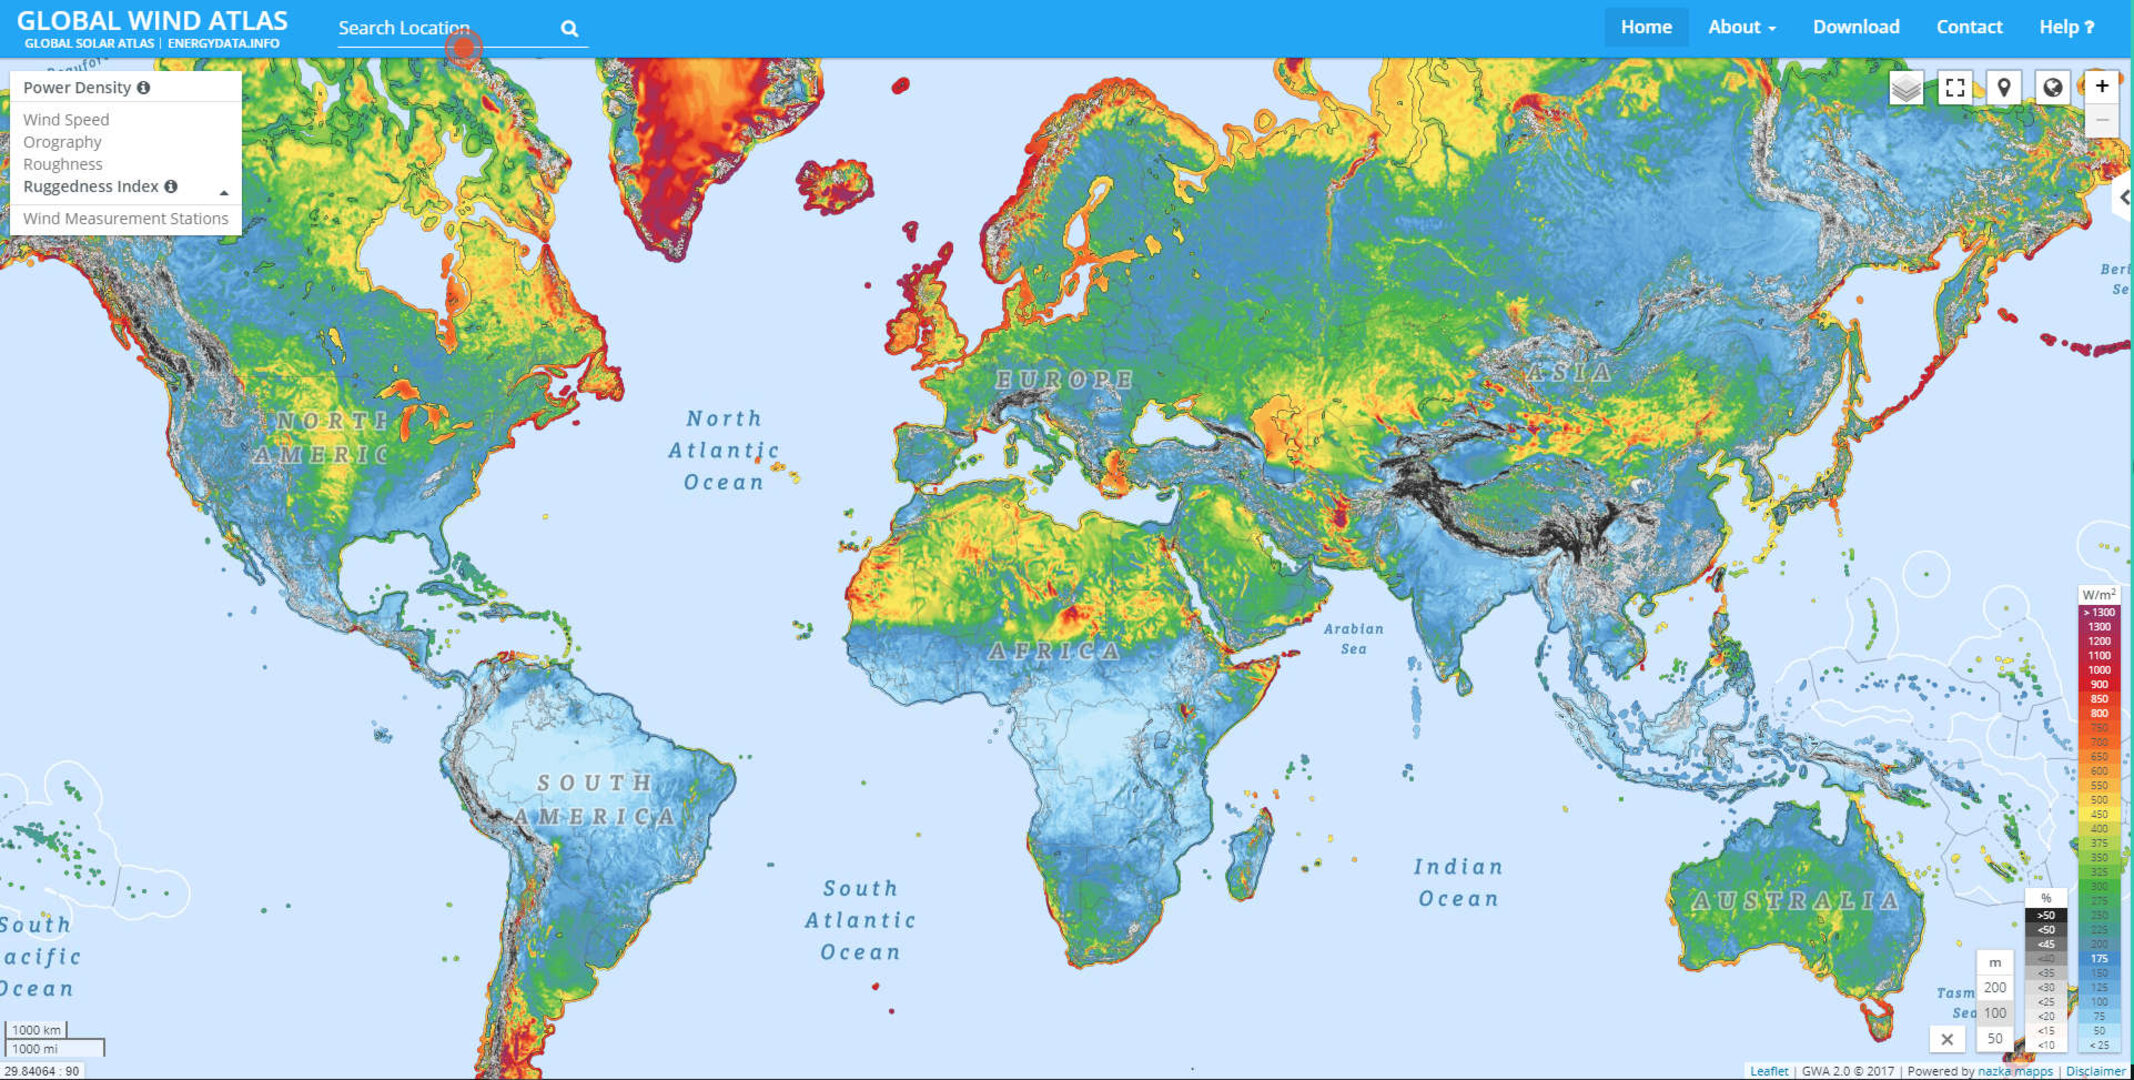
“The Global Wind Atlas is like a Google Maps for wind energy,” said Gil Lizcano from Vortex at the release last month. It is primarily meant for developing countries that are seeking to invest in renewable energy.
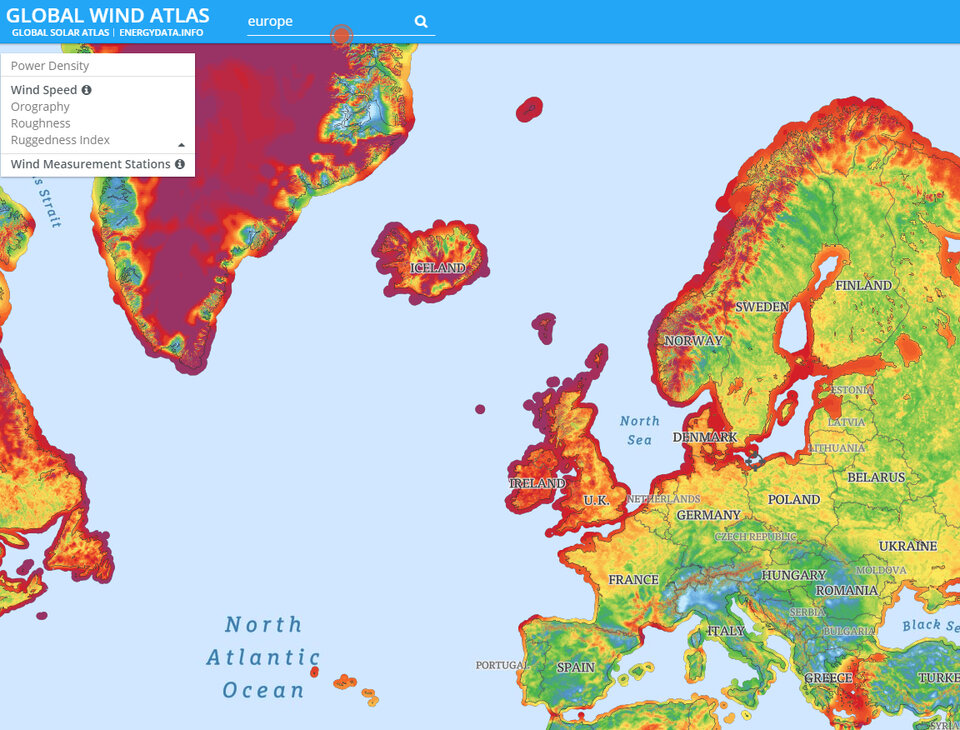
The new wind atlas has a user-friendly, intuitive interface and shows e.g. average wind speed and wind power density (an estimate of the power input to a wind turbine) for every 1 km grid point at 50, 100 and 200 m above ground level. The map can overlay other geographic information such as road maps or satellite imagery. This tool will make it easier for policy makers and investors to find locations suitable for doing ground-based wind measurements before building a wind farm.
“We have put wind energy "on the map" for countries who may not have been thinking about exploiting wind energy previously,” said Oliver Knight, Senior Energy Specialist at the World Bank Group. This is especially important for developing countries who might lack the funds to carry out expensive surveys. Solar and wind energy are the cleanest, lowest cost option for power generation in many countries and knowing where the best sites are may well level the playing field in terms of power provision on the international level.
In the near future, ESA's newest Earth Explorer mission Aeolus, due for launch around the middle of this year, will keep an eye on the winds on our planet and its data will be a welcome addition to expand the information compiled in the atlas.
