Exercise 2: Visualising and examining flooded areas in New Orleans caused by Hurricane Katrina - continued


Page123


Inspect the SPOT image again.

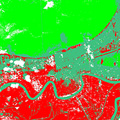
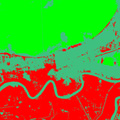
9. Can you outline the flooded parts of the city?

10. Give a short explanation of how the colours of the image can be used to map the flooded areas.
 
 
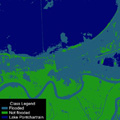
Supervised classification

You will now classify the SPOT image. Open a new RGB view and consider why it could be helpful to cut out some clouds in the east as well as the lake in the south using the “crop” function. Only two classes are interesting in this case: flooded and not flooded areas. You will perform a supervised classification. The first step is to select training fields for the following features:

Flooded
Not flooded
Lake Pontchartrain
 
 
Classified image
 
Classified image
 
 
After selecting these training fields, use the “Maximum Likelihood” algorithm to classify the image, setting the threshold at 5.


Classified image with 3x3 post classification filter applied
   
Classified image with 3x3 post classification filter applied
 
Now you can apply a post classification filter, either 3X3 or 5X5. You can also adjust the LUT in order to generate a more natural looking classified image, and to facilitate interpretation. You can then add a legend.


Classified image with legend
 
Classified image with legend
 
 
Inspect the classified image. Evaluate the quality of the classification.


11. Does the classified image depict the flooded areas well?

12. Can you explain why some areas are not mapped accurately?

Compare your classified map with maps of the flooding found on the Internet.

13. Can you list some benefits of using remote sensing in flooding situations in other parts of the world?

14. How can satellite images help in the rescue and relief operations following a disaster?

Page123


Last update: 17 April 2013


Storm surges

 •  Introduction (http://www.esa.int/SPECIALS/Eduspace_Disasters_EN/SEM075WX7YG_0.html)

Hurricane Katrina

 •  Introduction (http://www.esa.int/SPECIALS/Eduspace_Disasters_EN/SEMVX9WX7YG_0.html)

Exercises

 •  Exercise 1: Spiraling Hurricane Katrina from cloud tops to ocean waves (http://www.esa.int/SPECIALS/Eduspace_Disasters_EN/SEM02AWX7YG_0.html)
 •  Exercise 2: Visualising and examining flooded areas in New Orleans caused by Hurricane Katrina (http://www.esa.int/SPECIALS/Eduspace_Disasters_EN/SEMS1BWX7YG_0.html)

Eduspace - Software

 •  LEOWorks 3 (http://esamultimedia.esa.int/multimedia/LEOWorks3.exe)

Eduspace - Download

 •  Envisat and SPOT data (zip) (http://esamultimedia.esa.int/images/EduSpace/LEOWorksdata.zip)

Related links

 •  Hurricane Katrina - NOAA (http://www.katrina.noaa.gov/)
 •  Hurricane Katrina - Wikipedia (http://en.wikipedia.org/wiki/Hurricane_Katrina)
 •  National Hurricane Center - NOAA (http://www.nhc.noaa.gov/)
 •  Storm surge overview - NOAA (http://www.nhc.noaa.gov/ssurge/ssurge_overview.shtml)
 •  Global Monitoring for Environment and Security - ESA (http://www.esa.int/esaLP/LPgmes.html)
 •  International Charter Space and Major Disasters (http://www.disasterscharter.org/)
 •  Tropical weather and hurricanes - Physicalgeography (http://www.physicalgeography.net/fundamentals/7u.html)

Related news

 •  Envisat sees whirling Hurricane Katrina from ocean waves to cloud tops (http://www.esa.int/esaCP/SEMB41A5QCE_index_0.html)

Related videos

 •  Cyclone Floyd - 9 September 1999
(0.7 Mb)
(http://www.esa.int/SPECIALS/Eduspace_Disasters_EN/SEMJ52PK2AG_0.html)
 •  Cyclone Floyd - 13 September 1999
(1.5 Mb)
(http://www.esa.int/SPECIALS/Eduspace_Disasters_EN/SEM782PK2AG_0.html)
 •  Cyclone Floyd - 14 September 1999
(1.6 Mb)
(http://www.esa.int/SPECIALS/Eduspace_Disasters_EN/SEM892PK2AG_0.html)
 •  Cyclone Floyd - 15-16 September 1999
(3.4 Mb)
(http://www.esa.int/SPECIALS/Eduspace_Disasters_EN/SEMF72PK2AG_0.html)