| | | | |
 |
|
Earthquakes IntroductionIzmit earthquakeFloods Thessaloniki (Greece)Hurricanes Storm surgesHurricane KatrinaVolcanoes IntroductionAndean Volcanic BeltEtnaNyiragongo and Nyamuragira
| | | | | | | Exercise 1: Exploring the volcano
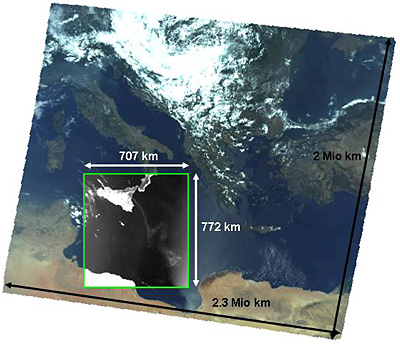
Subset of the MODIS image of 24 July 2001
Open the image
An image acquired on 24 July 2001 will be used in this exercise. Open LEOWorks and go to File > Open > etna_mod_2001-205_bd1-7. This file contains band numbers 1 to 7 out of the 36 MODIS bands. Select RGB and set band 1 to red, band 4 to green, and band 3 to blue (RGB 1-4-3). See the previous slide for the wavelength and bandwidth of these bands.
The preview looks like a natural colour composite, but in the image you can only see random colours.
1. Why do the colours appear like that?
Contrast Enhancement
MODIS data is in 16 bit format. That means that the colour space contains grey values from 0 - 65535 (the Landsat image before had 8 bit = 256 grey values). LEOWorks cannot display 16 bit data, therefore we have to perform a stretching exercise to the 8-bit colour space. Select Enhance > Interactive Stretching. LEOWorks automatically transfers the histogram in the 8-bit colour space. Move the right vertical line slightly to the left. Be aware that as a result of the stretching the original values will have changed.
Explore the image
2. Explore the image (Image Information, Statistics, Projection, etc).
3. Describe what you see in the image.
4. What are the main differences with the Landsat image? (Think about the resolution and size of the area)
5. How large is the area? Try to estimate first, then use the measurement tool.
6. What is the pixel size?
Image Information will help you answer the questions. The image is projected to WGS 84, UTM 33N. The pixel size is 1000 x 1000 m, and the area is approximately 550 000 km² = a bit more than half a million km².
Use the Measurement Tool to prove it. Go to Image > Measurement Tool and draw four lines at the borders of the image. When you return to the starting point, right-click on the mouse to end the polygon. You can switch between displaying the values for pixels or metres.
| |
| | Etna IntroductionMonitoring of volcanic hot spots and plumes Worksheet introductionExercise 2: Hot spot and plume detectionExercise 3: Monitoring a plume - animationEduspace - Download Etna_MODIS.zipEduspace - Software LEOWorks 3LEOWorks 3 Tutorial
|