|
The information contained in an image
In remote sensing, it is very important to understand the data provided by sensors in order to interpret them properly. The first thing to do is to understand what a satellite image is and why it is different from a photograph. The main difference between a photograph and a satellite image is that the photograph has an analogue format and is usually printed on paper before being interpreted. The satellite image has a digital format and a computer is generally used to analyse and interpret it.
Digital formats are very common these days. Can you give some other examples of data that are acquired from a digital source?
* See Answer 1 at the bottom of the page The analogue format is a format that saves all the data continuously. For example, when you take a photograph of your house, all the information is continuously spread over the photograph. There are no sharp edges between one part of the photograph and another.
The digital format, by comparison, saves each block of information separately. If you zoom in very close, you will see lots of squares of different colours in the satellite image.
The digital format is actually based on a mathematical procedure called a 'binary system' that permits computers to register data and later render it, to calculate and save data, and even to display an image. In fact, the binary system is the basics on which the whole computer world is based. The only thing a computer can 'understand' are electric pulses - either there is a pulse or there isn’t. This is a 'yes' or a 'no'; 0 or 1. Mathematicians thought that with computers, the system could not deal with decimals. A decimal system is how we usually count: from 0 to 9, then a new series of ten starts: 10 to 19, then 20 to 29, etc. With computers it goes from 0 to 1 then a new series starts again (0 when there is no electric pulse and 1 when there is one).
So in computer 'language', we have:
Note about the binary system:
The pixel A satellite image is made of many squares called pixels. Being the smallest unit on a satellite image, the pixel is very important: together the pixels provide all the information that constitutes a full image.
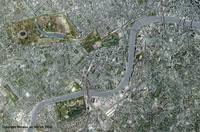
The first thing to know about a satellite image is its resolution. Imagine the satellite image of a town with a football stadium in the middle. The smallest square or pixel of that image could be the entire football stadium, or it could be the centre spot of the field. In the first case, it could be said that the resolution of the image is not very good; in the second case, there would be more detail to see on the image and it could be said that the resolution of the image is very good. The resolution of an image is the smallest distance between two adjacent objects that the sensor is able to identify.
Which one of the three London images on this page has the best resolution? And why?
* See Answer 2 at the bottom of the page
Each pixel in an image has a value. The value corresponds to the intensity of radiation reflected by the observed object within the wavelength range to which the sensor is sensitive.
For example, if the observed object is a plant (without flowers) and the sensor used is specially made to detect green, the intensity will be high. With that same sensor, if the observed object is a red car, the intensity will be very low.
RGB (Red, Green, Blue) A paradox of this system of acquiring images is that whilst many post-processed (finished) satellite images appear colourful, raw pixel values are only greyscale (ie between 0-255). Therefore during processing, multiple satellite images (from the same sensor, but in different bands or acquired on different days) are often combined to create a colourful image.
One colour (either red, green or blue) is attributed to each of the bands to produce a colour image. This is what is shown on the figure to the left. To learn more about the colours and making colour images, have a look at the various viewgraphs to see how colour is used, natural and false colour image construction and Munsell's colour scheme.
* Answer 1: Music CDs, CD Roms, DVD etc.
Last update: 15 April 2010
| |||||||||||||||||||||||||||||||||||||||||||||||||