1. Fill in the following table by marking, for each snow/ice type, if its reflectance is high, medium or low in the VIS, NIR and SWIR regions of the spectrum. An example is given for snow in the VIS.
| |
Snow |
Firn |
Glacier
ice |
Dirty
glacier
ice |
| |
VIS |
NIR |
SWIR |
VIS |
NIR |
SWIR |
VIS |
NIR |
SWIR |
VIS |
NIR |
SWIR |
High
reflectance |
X |
|
|
|
|
|
|
|
|
|
|
|
Medium
reflectance |
|
|
|
|
|
|
|
|
|
|
|
|
Low
reflectance |
|
|
|
|
|
|
|
|
|
|
|
|
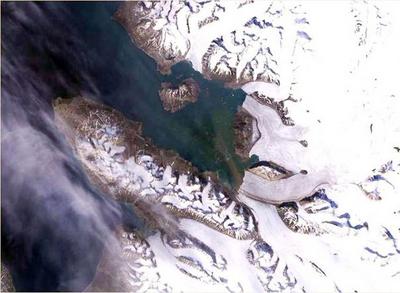
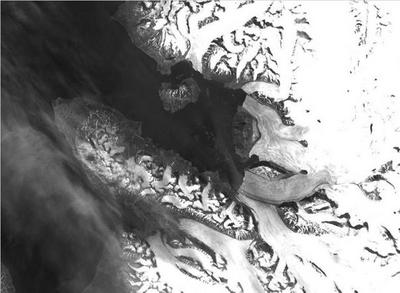
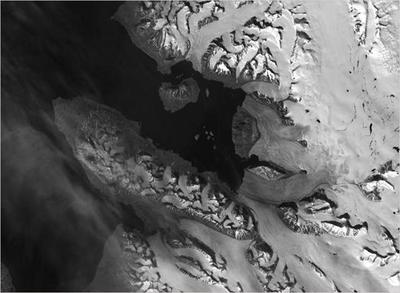
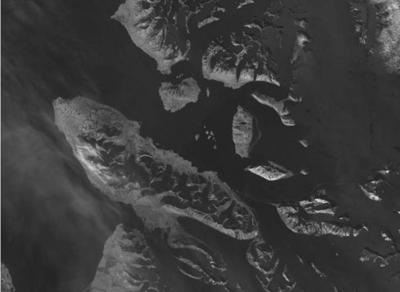
2. Print out the above colour, VIS, NIR and SWIR images. Place a transparency on one of the four and try to outline some areas with snow, firn and ice. When you are finished, put the transparency on the other images and compare how you outline the areas on these.