| | Exercises - Page 2
Page 12 12
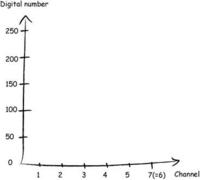
8. Draw a coordinate system like the one below on a piece of paper and mark all numbers you got in the above table as crosses. Use different colours for each of the surface types (glacier, water, land) and connect the crosses of each surface type. You've now created your own spectral signatures! Describe the differences between the three surface types. Compare your curves to the ones from others in your class. You can now see that, in principle, it is possible to tell from the spectral curve of an individual point on an image what the surface type is at this point. This is the principle of multispectral remote sensing.
9. Using the above method, can you distinguish between ice and snow using the reflection values?
10. Close all your images and create an animation of all 6 channels you have. Under Tools > Animation, select all 6 single-channel files and run the animation. It runs through all channels so that you can follow the change in reflectivity for a certain point. Adjust the Animation Speed as appropriate. Be careful to choose the single-channel image files, not the multi-channel file! Alternatively, pause the animation using the pause button and go stepwise through the images.
11. Close all your images and create colour composites. Open the multi-channel file, choose RGB colour combinations for different combinations of image channels. Display channel 1 in B(lue), channel 2 in G(reen) and channel 3 in R(ed). In order to do this, click R and select channel 3 in the list, click G and select channel 2, click B and select channel 1. To enhance the images select Enhance > Histogram Equalization or Enhance > Interactive Stretching.
What does this image look like? Compare the result with a so-called false colour composite which you get when loading the multi-channel image file again and, for instance, displaying channel 3 in blue, channel 4 in green and channel 5 in red. What are the differences?
12. Based on your findings, describe where you find glaciers, snow, land areas and the sea on your satellite image.
Conclusions
Snow and ice show high reflectance in the visible light, medium to high in the near infrared, and very low in the shortwave infrared. The variation of reflectance from visible to near and shortwave infrared light is often very typical for a certain surface type. This variation can therefore be used to automatically map the surface types from a multispectral image. This is the principle and purpose of multispectral remote sensing. In your example this works well for the surface types ice, snow, water and land. However, it may happen that different surface types have similar spectral variations (=spectral signatures), so that they can hardly be mapped multispectrally.
Page12
| |