|  | Cordoba 2009 with training fields | |
Exercise 2: Land cover classification (cont'd)
Page 12 12
Change the colours of the polygons by changing the properties of each class.
For LEOWorks3: Use the Inspect TF Statistics and select from the table which TF you want to inspect on the image.
Now you can see which pixels have been selected as training fields for the supervised classification. All the small marked areas on the image present pure land cover classes, of either urban land, vegetation or bare soil. These training fields have been created by selecting pixels that contain only one land cover. After extracting the information contained in every band of these pixels, a (statistical) signature of each type of land cover and sample is created.
1. Inspect the training fields. Study the statistics of each training field in each of the three land cover classes. Are they homogeneous within a class? Check the Standard Deviation to answer this.
The algorithm needed to execute the classification is called ‘maximum likelihood’. This process assigns each pixel of the entire image to the land cover class it most likely belongs to, based on the a priori information and statistical measures.
Start the process of Classification. Select all the bands of 2009_cordoba images. Set the threshold at 0, so that all pixels are classified.
2. When you compare your land cover map with the images, which class represents which land cover?
3. Describe the colour and the homogeneity of each class in the original image.
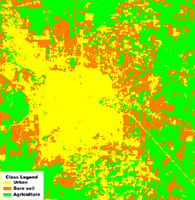
| | | Example of a classified image |
Add the legend and eventually change the colours of the land cover classes. Study the Report (No. and area of pixels in each class).
You may produce the following output:
4. Judge the quality of the classified image, which is somehow a crude land cover map. Compare it with the original image (Cordoba 2009, bands 435).
Can you find some errors, e.g. wrongly classified areas?
Discuss what could be done to improve the quality of the classification.
Save this classified image as Cordoba_2009_class, but keep the RGB image on your screen, as we will need it for the next exercise.
Page12
|