|
Vegetation Indices
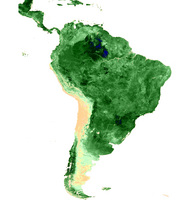
By combining the daily Vegetation Indices into 8-, 16-, or 30-day composites, scientists create detailed maps of the Earth’s green vegetation density that identify where plants are thriving and where they are under stress due to lack of water. To determine the density of green on a patch of land, researchers must observe the distinct colours (wavelengths) of visible and near-infrared sunlight reflected by the plants. When sunlight strikes objects, certain wavelengths of this spectrum are absorbed and other wavelengths are reflected. The pigment in plant leaves, chlorophyll, strongly absorbs visible light (from 0.4 to 0.7 µm) for use in photosynthesis. The cell structure of the leaves, on the other hand, strongly reflects near-infrared light (from 0.7 to 1.1 µm). If there is much more reflected radiation in near-infrared wavelengths than in visible wavelengths, then the vegetation in that pixel is likely to be dense and may contain some type of forest. If there is very little difference in the intensity of visible and near-infrared wavelengths reflected, then the vegetation is probably sparse and may consist of grassland, tundra, or desert. Nearly all satellite Vegetation Indices employ this difference formula to quantify the density of plant growth on Earth — near-infrared radiation minus visible radiation divided by near-infrared radiation plus visible radiation. The result of this formula is called the Normalized Difference Vegetation Index (NDVI). Written mathematically, the formula looks like this:
NDVI = (NIR — VIS)/ (NIR + VIS) NDVI is calculated from the visible and near-infrared light reflected by vegetation. In the figure below, healthy vegetation (left) absorbs most of the visible light that hits it, and reflects a large portion of the near-infrared light. Unhealthy or sparse vegetation (right) reflects more visible light and less near-infrared light. The numbers on the figure are representative of actual values, but real vegetation is much more varied.
Last update: 18 April 2013
| ||||||||||||||||||||||||||||||||||||||||||