Coastal change Danube Delta change detectionOil spillsDeforestation Bardia National ParkCongo River BasinKameng-Sonitpur Elephant ReserveKilimanjaroRondoniaShillong and GuwahatiIce Antarctica 2003Climate change and glaciersGlacier analysis using radar imageryGlacial retreat in the AlpsGlacier Ice FlowMonitoring of glaciers in the HimalayasRemote sensing of ice and snowUrbanisation CairoCity of KathmanduCórdobaHimalayasKathmandu ValleyLagosVegetation Annapurna Conservation AreaLost in the AndesNgorongoro Conservation AreaNiger Inland DeltaVegetation in South America
|  | | | | | | Radar
Radar is the commonly used abbreviation for RAdio Detection And Ranging. As a measurement signal it uses microwave radiation with wavelengths in the order of mm, cm, and dm. The technique measures distances (i.e. ranges) between the sensor and the target.
The two main radar techniques used to monitor glaciers are radar altimetry and Synthetic Aperture Radar (SAR). For both techniques a radar signal is sent by a sensor, the returned signal is recorded, and its travel time to Earth and back to the sensor is analysed. Signal strength and other signal properties are also analysed.
How much microwave energy is backscattered (i.e. reflected) to the sensor depends on a number of snow and ice properties. The most important surface and material properties that influence microwave backscatter are:
- surface roughness,
- humidity or wetness of snow and ice,
- the structure (in depth) of the snow and ice, e.g. melt or ice layers in the snow.
As a result of these factors, snow and ice can look very different in radar images.
- Wet snow and ice both absorb a lot of microwave energy and reflect it away from the sensor. Both processes are equally important. The actual amounts of absorption and reflection depend, among other things, on the radar wavelength, the incidence angle (that is the angle to the vertical at which the radar signal hits the ground) and the smoothness of the surface. When absorption and reflection are away from the sensor, little energy arrives back to the sensor, and the radar image is dark.
- Dry snow often appears bright because microwaves penetrate into the snowpack, where they are reflected by many fine ice crystals and ice lenses.
- Radar waves travel through cold, dry snow, making this snow almost invisible to the radar sensor. The recorded backscatter usually stems from the material below the dry snow, e.g. glacier ice or bedrock.
- Rough and wet ice, e.g. crevasse zones or rough, wet snow, scatter a lot of microwave energy back to the sensor and consequently often appear bright in the radar image.

Glacier section of an ASAR image of 13 June 2006 near Kronebreen

Winter ASAR image taken on 29 February 2008 over Kronebreen
| | The bright area in the middle of this ALOS PALSAR image of 24 November 2006 shows a heavily crevassed calving front | |
The main advantage of radar techniques compared to optical ones is its ability to operate during the night as well as through clouds. These two radar properties are very important in areas with frequent cloud cover, as is the case for many glacier regions, and in polar regions where long periods of the year are totally dark because of the absence of the Sun (polar nights).

Envisat ASAR radar image of Kronebreen of 13 June 2008
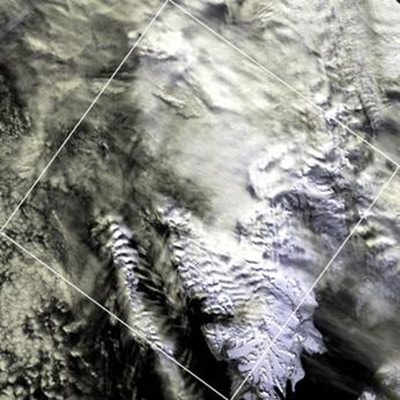
MODIS image taken on the same date and at the same time

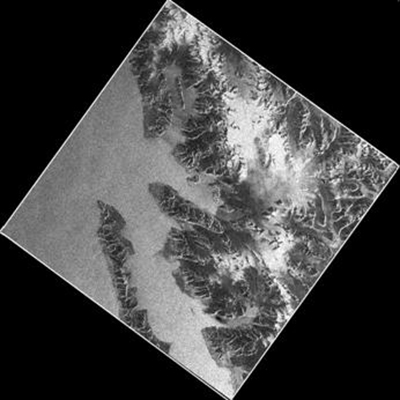
Envisat ASAR radar image of Kronebreen of 26 February 2008

MODIS image taken on the same date and at the same time
The comparisons below show an optical and radar image of the same region in more detail.

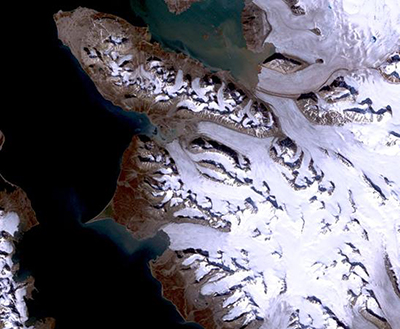
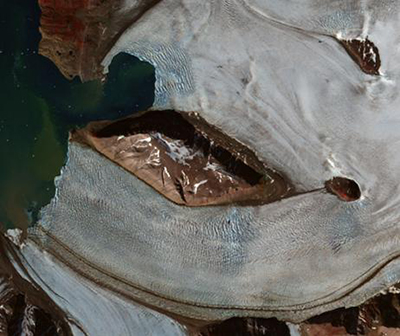
True colour optical satellite image of Brøggerhalvøya

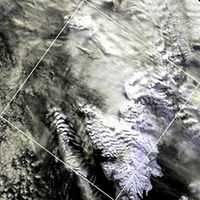
Envisat ASAR image of the same area
In the image acquired by the ASAR instrument onboard the Envisat satellite the lower glacier parts appear dark because of ice and snow melt, which makes the surface wet. The upper parts of the glaciers don’t seem to be affected by melt yet, and the microwaves are therefore able to penetrate into the snow pack where they are backscattered to the sensor (so-called volume scattering). Here the volume scattering is within many ice layers, ice lenses and firn crystals in the snow and firn pack. Volume scattering is scattering that takes place inside a material. Therefore the signal has to penetrate into the material, where it usually bounces and reflects off different components within the material.

ASTER optical image taken on 12 July 2002 over Kronebreen

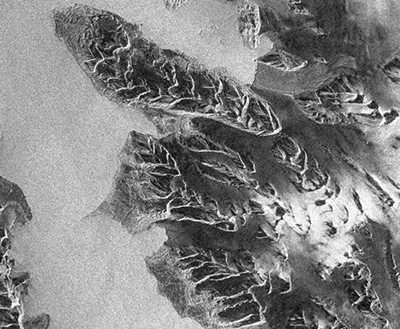
ALOS PALSAR radar image of 24 December 2006 of the same area
Even if the above PALSAR image was taken in winter when the area was completely covered in cold snow, one can clearly recognise large variations in the degree of the microwave backscatter (i.e. amplitude). The bright areas are caused by pronounced surface roughness – here crevasses. In winter they are covered by snow and, therefore, almost invisible to the human eye. The microwave signals can, however, penetrate through the cold and dry snow cover, down to the crevasses where they are backscattered.
| |
| | Glacier analysis using radar imagery IntroductionBackground Synthetic Aperture Radar (SAR)Exercises Worksheet introductionExercise 1: Multitemporal radar and multispectral optical dataExercise 2: The influence of weather conditions on radar imageryConclusionsEduspace - Software LEOWorks 4 (MacOS)LEOWorks 4 (Windows)LEOWorks 4 (Linux)Eduspace - Download Images_Glaciers.zipGoogleEarth file
|