| | Synthetic Aperture Radar (SAR)
SAR is the abbreviation for Synthetic Aperture Radar. It is a special radar technique that allows users to obtain high-resolution radar images from large distances, e.g. from space. With radar, microwaves are used to measure distances (ranges).
Unlike a nadir-sending radar altimeter, a SAR system sends out radar pulses to the side. Through this side-looking principle, the radar returns signals from different objects on Earth to the sensor at different times. This allows discrimination of the objects. Side-looking radar pulses form image lines (i.e. range dimension). Another image dimension (i.e. azimuth dimension) is formed by the movement and direction of the sensor, which continuously sends and receives radar pulses.
SAR images are useful for the study of the characteristics of ice and snow, as well as their changes over time. In addition, ice flow can be measured from repeat SAR images using image correlation (it is often called ‘speckle tracking’ for SAR images).
Radar and SAR record the time of a return pulse and its strength, as well as the phase of the microwave. These phase signals produce an interferogram between two SAR data acquisitions. Radar interferometry (InSAR) is used to measure ground elevations, whereas differential InSAR (DInSAR) is used to measure ground displacements such as glacier flow.
 | | | Photo of the Gruben area in the Swiss Alps taken from an airplane |
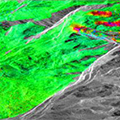
Figure 1 is a radar interferogram of the Gruben area. The colour cycles are similar to contour lines and show the topography of the terrain as it is seen by the InSAR sensor. In the three areas indicated by the blue arrows the colour cycles are strongly distorted because of glacier movement between the two SAR images forming the interferogram (see the three glaciers in the photo of the Gruben area in the Swiss Alps taken from an airplane).
| | Fig. 1: SAR interferogram over Gruben area | |
If the ice wasn’t moving, the colour cycles (i.e. fringes) would be parallel to the contour lines. In fact, the colour cycles in the first interferogram (Fig.1) over the terrain around the glaciers look very similar to the colour cycles that were simulated from an elevation model (second interferogram seen in Fig.2).
| | | Fig. 2: Topography-only interferogram simulated from a digital elevation model |
On the other hand, when the terrain is not moving, contour lines can be calculated from an interferogram and a derived digital elevation model. On the three glaciers, however, not only are the colour cycles caused by topography, they are also caused by daily ice movement between two acquisition dates.
If one knows the topography of the area, one can simulate the topographic fringes (Figure 2) and thus separate the topographic and ice-dynamic contribution to the colour cycles simply by subtracting the simulated topographic fringes (second image) from the original interferogram that contains both topographic and movement fringes (Figure 1). One can therefore measure ice movement with very high precision (Figure 3).
| | Fig. 3: Displacement calculated as the difference between the original interferogram and the simulated topographic interferogram | |
In summary, for stable terrain, SAR interferometry can be used to measure terrain elevations, e.g. on a glacier. For unstable terrain (e.g. flowing glaciers) SAR interferometry can be used to measure ice movement with high accuracy. If more than one SAR image pair is available, both techniques can be combined to simultaneously measure glacier elevation and movement.
| |