|
Exercise 1 - Image inspection and vector drawing Open the Landsat images from 1984 and 2000 by following the steps in section 3.1 of the LEOWorks 3 tutorial. Only band 5 from both images needs to be opened. This band is good for distinguishing between land and water. Notice that in the 1984 image the island appears wider in the centre, but in the image acquired in 2000 it seems to be longer. We don’t yet know this for sure, but let’s try to prove it! To analyse the changes we can start by digitising the contour of the island in the 1984 image. To do this, follow the steps in section 7.4 of the LEOWorks 3 tutorial to draw a polygon around the island. Name the polygon theme wl_1984 (water line). If this exercise is difficult, you can open an already created theme called Sacalin_1984.shp in the “vectors” folder (follow steps 1 to 3 in section 7.3 of the LEOWorks 3 tutorial), inputting the following projection parameters:
In order to see the changes, we will now overlay the contour of the island extracted from the 1984 image onto the same island in the 2000 image. Follow steps 1 to 3 in section 7.3 of the LEOWorks 3 tutorial to overlay the theme created from the 1984 image onto the 2000 image. The result should look like the following:


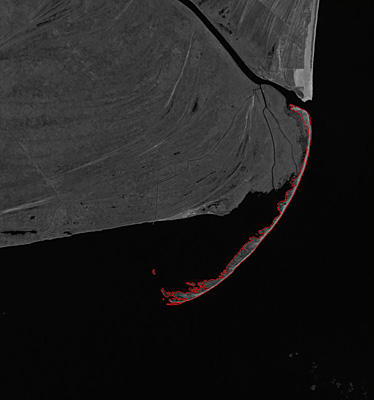
Sacalin water line for 1984, overlain on the 1984 image (left) and 2000 image (right). (USGS, ASRC)
What changes do you notice? Are there unchanged parts of the island? The island has been affected, in the past 16 years, by erosion in the central and northern part and by accumulation to the south. Compared to the initial position of Cape Roch, how many metres has it progressed? For an accurate answer use the measurement tool, as described in section 3.8 of the LEOWorks 3 tutorial.
From 1984 to 2000 the island retreated in the north by 270 metres, which corresponds, for the past 16 years, to a rate of -16.8 m/yr. In the central part the water line moved to the west by 480 metres, which corresponds to a rate of -30m/yr, almost double compared with the northern part. The position of Cape Roch, the southern extremity of the island, has progressed by more than 1700 metres. This indicates a rate for the accumulation process of over 100m/yr.
Calculate the surface area of the island in 1984 and 2000. What do you notice? Has the surface area increased or decreased?
Surface area of the island in 1984: 6057192,6 m2 or 6,057 km2
Surface area of the island in 2000: 4870360,6 m2 or 4,870 km2 Surface area difference between 1984 and 2000: the area has decreased by -11868320 m2 or -1,187 km2 in the past 16 years, implying a rate of -741770m2/yr, or -0,74 km2/yr
What other changes do you see at the shoreline?
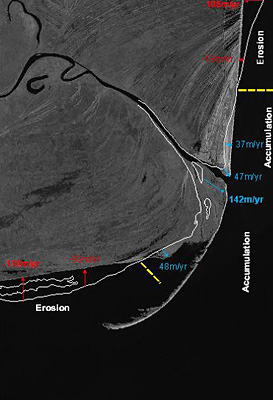
Identify areas of erosion and accumulation. Calculate the maximum rate of erosion and accumulation between 1856 and 2000.
In the northern part of the mouth is an area of accumulation, developed over a length of 5,7 kilometres. Here the shore has advanced at a maximum rate of 47m/yr in front of Cape Buival, the rate gradually decreasing to the north. Further north is an area of strong erosion at a maximum rate of -106m/yr. South of the mouth the situation is similar, accumulation in front of the secondary delta (142m/yr) followed by an area of erosion (with a maximum rate of -116m/yr). From the appearance of the coastal zone in 1856, we can conclude that it was an old barrier island, similar to the actual Sacalin, which was eroded over time.
Using the other themes in the vectors folder create other maps at the following time scale intervals: 1856-1945, 1945-1961, 1961-1984, 1984-2000. Calculate the rates of advance/retreat for each period. After that try to respond to the following question:
What do you think will be the trend of future development of the island?
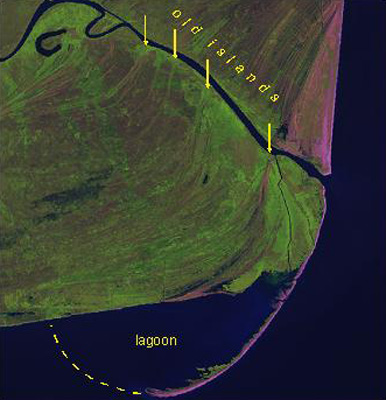
If accumulation processes continue to the south, the island will join the delta, leaving behind a lagoon, which in time will be affected by deposition. The lagoon will then become a marsh area. Look carefully at the Landsat image (band combination 543) and try to identify old islands, which have become levees in the delta.
Last update: 16 April 2013
| ||||||||||||||||||||||||||||||||||||||||||||||||||||||||||||||||||||||||||||||||||