|
Urban sprawl in Córdoba
According to the UN, by 2070 70% of the world population will be urbanised. The number of today’s 21 megalopolises (cities with more than 10 million inhabitants) will have doubled by that time. In this case study we will look at Earth observation techniques that help monitor the growth of a city. These techniques can help city planners prepare for and manage the arrival of new people. Traditionally, land cover changes like urban sprawl were assessed using demographic information and aerial photography. Today, images acquired by satellites at intervals are also used to detect changes in land use and land cover. In fact, such data are now routinely available at frequencies of up to 1 day between image acquisitions and spatial resolutions ranging from a few decimetres to kilometres. The most common technique used to monitor urban changes with satellites involves comparing imagery-based land cover maps of different years.
We will use Landsat data, since this satellite has provided information on the Earth’s surface for the past four decades. Moreover, Landsat data come in different spectral bands. As described in the Remote Sensing section of Remote Sensing Principles on this website, the different colours represent signals from urbanised areas, from vegetation, water and soil. These can be used to distinguish types of land cover. With the help of this information we are going to produce a land cover map.
Two general methods to create a land cover map from a satellite image exist: supervised and unsupervised classification. We will use the supervised method, which is based on information taken from an external source, or information extracted from the image itself by an experienced image interpreter, or information derived from sample locations visited on the ground.
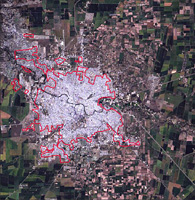
Finally we propose to work with the GIS tool in the LEOWorks image processing software to generate the city borders in different years and calculate the urbanised surface on each image. This is a quantitative approach similar to what is done professionally in urban planning offices. Last update: 23 October 2013
| ||||||||||||||||||||||||||