| | | | |
 |
|
Coastal change Danube Delta change detectionOil spillsDeforestation Bardia National ParkCongo River BasinKameng-Sonitpur Elephant ReserveKilimanjaroRondoniaShillong and GuwahatiIce Antarctica 2003Climate change and glaciersGlacier analysis using radar imageryGlacial retreat in the AlpsGlacier Ice FlowMonitoring of glaciers in the HimalayasRemote sensing of ice and snowUrbanisation CairoCity of KathmanduCórdobaHimalayasKathmandu ValleyLagosVegetation Annapurna Conservation AreaLost in the AndesNgorongoro Conservation AreaNiger Inland DeltaVegetation in South America
| | | | | | | Exercise 1: Correlation of repeated images (LEOWorks 3) (Part 2)
Page 12 12
Now select the November 2001 image and go to GIS > GIS Tools and File > Open Theme. Select the theme that you just created in the January image. Transformation method: Arbitrary, Load mode: Map Based.

January 2001
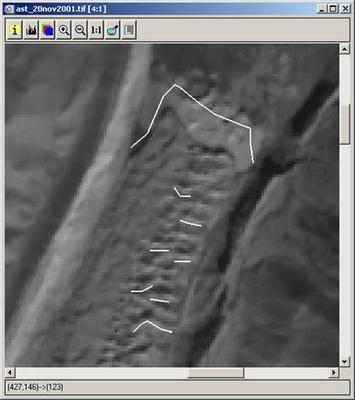
 November 2001
Example of digitising the lower part of the glacier
Now the crevasses you digitised on the January image are superimposed on the November image. You will note that the digitised lines are not on the crevasses you selected. This difference is due to glacier movement. You can measure it using the Measure Tool: Image > Measure Tool. Don’t forget to set the Units in the Measure Tool menu bar to Meters and Pixel Size to 15m.
Note your measurements in a table.
| Glacier part | Displacement Jan – Nov 2001 | | Lower part | 61 m, 47 m, 45 m, 67 m; average: ...
(example) | | Middle part | ... | | Upper part | ... |
|
9. How much did the glacier move from January to November 2001? Is the glacier movement the same at every location?
10. Try to explain the reasons for these differences.
11. How much did the ice front retreat, or the lake grow, respectively? Where did you have problems finding crevasses in both images and measuring displacement?
Conclusions
For a large number of glaciers it is possible to measure glacier flow using repeat optical satellite images. There are, however, a number of limitations:
- The ice movement observed must be larger than the pixel size of the sensor used (here it is of 15 m). Movement cannot easily be detected if it is smaller than that.
- There have to be clear features on the glacier that can be tracked during the period of observation (e.g. crevasses or rocks).
- Snow cover on one or both of the images prevents us from measuring displacement because snow contains no suitable features with sufficient contrast.
The magnitude and direction of glacier flow is important in order to understand glacier dynamics and glacier reaction to climate change. It is easier to estimate the development of glacier contact lakes when we know more about the glacier flow into the lake. When more than two repeat images are used, variations in glacier flow can be observed. Such variations may be linked to climatic influences, such as changes in glacier mass balance.
Page12
| |
| | Glacier ice flow IntroductionBackground The dynamics of glaciersMultitemporal image correlationExercises Worksheet introductionExercise 1: Correlation of repeated images (LEOWorks 3)Eduspace - Software LEOWorks 3Eduspace - Download ASTER.zipGoogleEarth file
|