ERS-2 operations
Editor's note: The ERS-2 mission came to an end in 2011. This article will no longer be updated and contains some information that is now out of date.
If you are looking for information regarding the atmospheric reentry of ERS-2 foreseen for February 2024, please click here.
| ROLE | Earth observation (EO) |
| LAUNCH DATE | 21 Apr 1995 |
| LAUNCHER/LOCATION | Ariane 4/Kourou, French Guiana |
| LAUNCH MASS | 2516 kg |
| ORBIT | Sun-synchronous, polar, 800 km |
| PERIOD | 100 minutes |
| NOMINAL MISSION | Complete |
| + Wind Scatterometer & GOME: first instruments of their kind + | |
The mission
ERS-2 is ESA's second EO mission, (after ERS-1) and was launched in 1995.
Both carry a comprehensive payload including a Synthetic Aperture Radar (SAR) and a radar altimeter for studying sea surface temperatures and winds; ERS-2 additionally carries a sensor for atmospheric ozone research.
When they were launched, the two ERS satellites were the most sophisticated EO spacecraft ever developed and launched in Europe.
In March 2000, a computer and gyro control failure led to the end of ERS-1's mission. The ERS-2 mission has however continued to be a great success, lasting well beyond its original three year design lifetime and overcoming critical on-board problems.
In 2001, after the failure of several on-board gyro systems, an innovative new scheme for flying and controlling the ERS-2 mission without gyros was invented by a group of engineers across ESA and industry- the "gyro-less" yaw steering mode or "Zero-Gyro Mode". In 2003, a failure in the on-board data storage system led to the mission being re-designed as "real-time" only, with science data directly relayed to ground at the time of acquisition. These in-flight adaptations have enabled the mission to be extended well beyond its design lifetime, and ERS-2 had already surpassed more than 82 000 orbits at the end of 2010.
The mission ended on 5 September with the 'passivation' and switch-off of ERS-2.
Editor's note: This article will no longer be updated and contains some information that is now out of date.
The Flight Control Team
The ERS-2 Mission Operations Control Centre is located at ESOC, Darmstadt, Germany; the Flight Control Team operates from the combined Earth Observation Dedicated Control Room (DCR).
The small, 8-person Flight Control Team is managed by Spacecraft Operations Manager (SOM) Frank-Jürgen Diekmann, from Germany, and is responsible for command and control and overall operations of the satellite, with in-depth support from other ESOC teams.
Mission operations overview
The ERS-2 mission comprises the ERS-2 satellite, ground segment facilities at ESOC and other locations for data processing and archiving, and ground stations for telemetry and data receipt. The mission uses advanced microwave (radar) techniques to provide measurements of the Earth's atmospheric and surface properties regardless of cloud and sunlight conditions. This contributes to the scientific study and understanding of our climate and the environment.
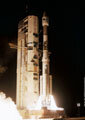
The satellite was launched from Europe's Spaceport in French Guiana on 21 April 1995 by an Ariane-4 rocket and was injected directly into its Sun-synchronous polar orbit at an altitude of approximately 800 km. ERS-2 is a three-axis stabilised, Earth-pointing satellite, orbiting Earth with an inclination of about 98.5°, which gives it a visibility of most areas of the Earth as the planet rotates beneath the satellite's orbit.
The orbital period is approximately 100 minutes. Minor adjustments of the orbital inclination and of the spacecraft altitude allow the orbital track pattern on the Earth's surface to repeat itself exactly after a certain number of days, for example 3, 35 or 168, with 35 chosen as the current option to synchronise with Envisat until November 2010, when the Envisat orbit was changed.
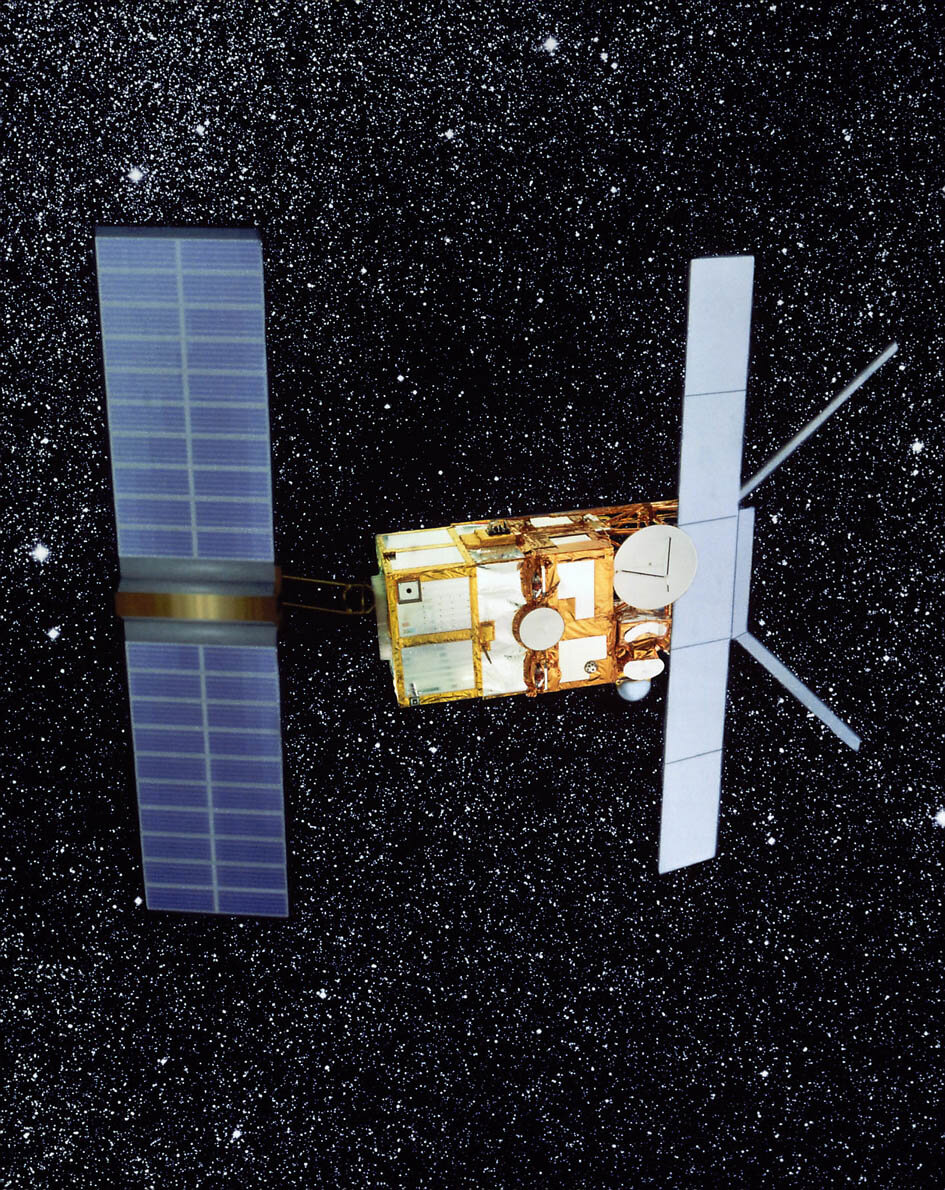
The ERS spacecraft platform is based on France's SPOT (Système Probatoire d'Observation de la Terre) platform, modified according to ERS power, energy-storage and attitude requirements.
The solar array consists of two 5.8 x 2.4m wings, on which are mounted 22 260 solar cells providing an average power of about 2.5 kilowatts. Four nickel-cadmium (NiCd) batteries are sized to allow payload operations during non-sunlit periods. Attitude reference in pitch and roll is obtained from infrared horizon sensors and for yaw from narrow-field Sun sensors aligned to point at the Sun as the satellite crosses the day/night boundary.
While the mission is operating well, ERS-2 has operated since February 2001 without gyroscopes, and the on-board tape drive failed in June 2003, leaving the instruments operating only within visibility of a ground station (additional ground stations have been brought online to increase data-gathering abilities).
The Wind Scatterometer and GOME (Global Ozone Monitoring Experiment) were the only instruments of their kind until the launch of MetOp-A on 19 October 2006.
The ERS-2 mission ended on 5 September 2011. The final critical step was to ‘passivate’ ERS-2, ensuring that all batteries and pressurised systems were emptied or rendered safe in order to avoid any future explosion that could create new space debris. Before all systems on board were switched off, the remaining fuel was used in a series of manoeuvres to lower the satellite’s average altitude from 785 km to about 573 km. From there, the natural descent will continue until the satellite re-enters and burns up in the atmosphere well within 25 years.
The ground stations
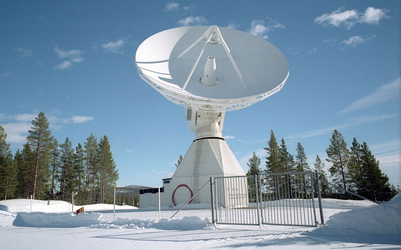
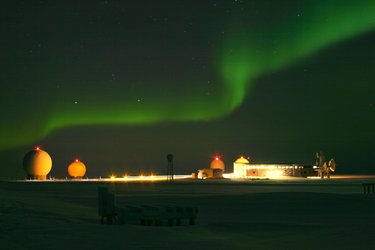
Kiruna, Svalbard
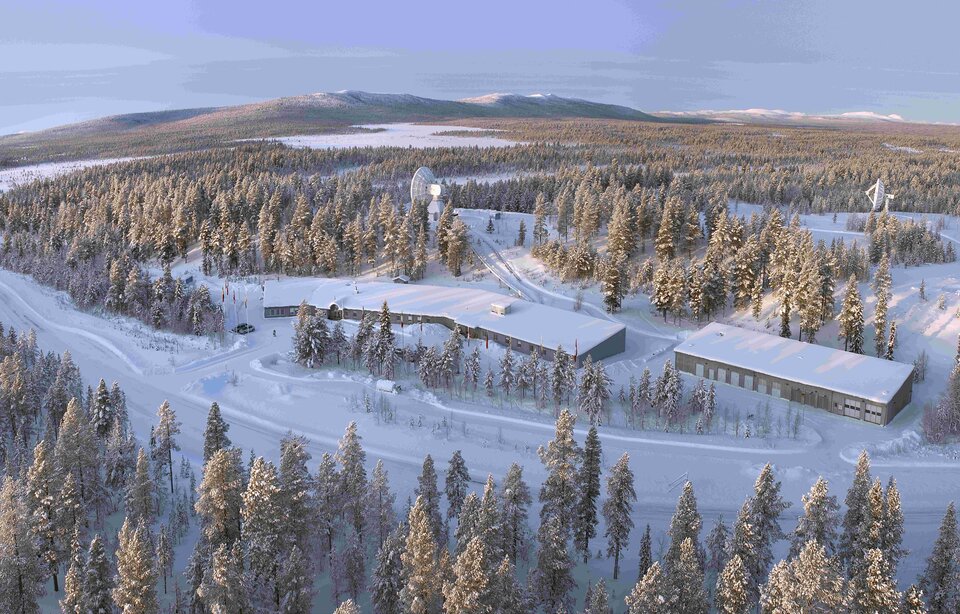
The ERS-2 prime ground station is Kiruna, Sweden, with S- and X-band capability. Kiruna gives visibility of the satellite for 10 of 14 daily orbits. X-band stations for payload data reception are located in various locations across the globe (currently 12 stations are used). Svalbard, Norway, is also used regularly.
In addition, the ESTRACK stations at Kourou, Perth and Maspalomas are used when necessary.
Ground segment & mission control system
The ERS-2 ground segment at ESOC uses the SCOS-B mission control system, the predecessor to SCOS-2000.
In addition to the satellite control facilities at ESOC, the ERS-2 ground segment also includes facilities responsible for the acquisition, processing, distribution and archiving of the satellite's data. In general, facilities for end-users and exploitation of the data have been established at ESA/ESRIN in Frascati, Italy, while the satellite planning and control functions, including control of the primary ground station, are the responsibility of ESOC.
The characteristics of the ERS-2 space segment - the satellite's multi-sensor payload, orbit configuration and power requirements - require the implementation of a network of ground stations around the world to acquire the high-bit-rate SAR (synthetic aperture radar) data for which only direct readout is possible (data is not stored on board). Also, initially, additional facilities were required for downloading, once per orbit, the low-bit-rate data, which was stored on board.
However, due to the failure of the on board recorders in 2002 and 2003, low-bit-rate data can also no longer be stored on board and these, too, must be downloaded in real-time via the network of supporting X-band stations.
The platform and payload

The platform
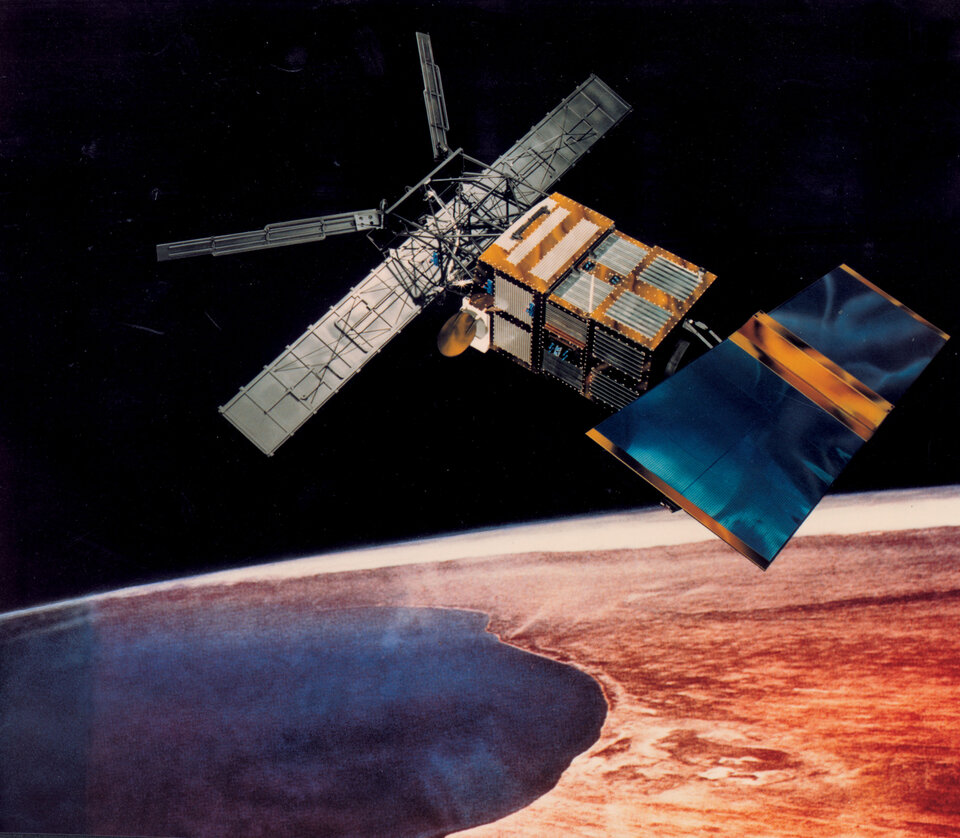
ERS-2 is nearly identical to ERS-1. The satellite is 11.8 m tall, the solar panel is 11.7 x 2.4 m, the SAR antenna is 10 x 1 m and the total mass is 2516 kg.
The payload
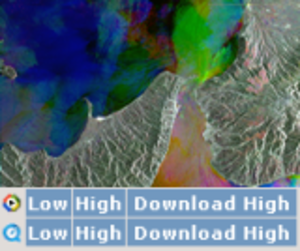
Compared to ERS-1, ERS-2 is equipped with additional instruments that measure the ozone content of the atmosphere and monitor changes in vegetation cover more effectively. Like ERS-1, ERS-2 carries the same active radar instruments, the largest of which is the SAR (synthetic aperture radar). In imaging mode, the SAR generates detailed scenes of a 100 km strip of regions over which the satellite flies and determines, over the oceans, wind speed and direction together with wave height, length and direction.
The second active instrument is the radar altimeter, which measures with extreme precision the distance between the satellite and sea or ice surfaces and mean wave height.
ERS-2's passive instrument load includes an along-track (i.e. in the direction of flight) scanning radiometer (ASTR) equipped with six channels in the infrared and visible parts of the spectrum. The three channels in the visible spectrum were used to observe vegetation, for example for crop forecasting or monitoring of deforestation. Unfortunately ATSR could not be restarted following scan mirror problems and was permanently turned off in 2008.
Two further instruments on board ERS-2 serve to enhance the accuracy of other instruments. These are PRARE (precise range and range rate equipment) units, which have the task of measuring the satellite's orbit with outstanding precision, and a microwave sounder to determine atmospheric humidity. PRARE is no longer in use, however.
Instruments comprise:
|
Instrument |
Function |
| RA - Radar Altimeter | Ku-band (13.8 GHz) nadir-pointing active microwave sensor designed to measure the time return echoes from ocean and ice surfaces. |
| ATSR - Along Track Scanning Radiometer (no longer used) | Comprises an Infra-Red Radiometer (IRR) and a Microwave Sounder (MWS). On ERS-2, the IRR is equipped with additional visible channels for vegetation monitoring. |
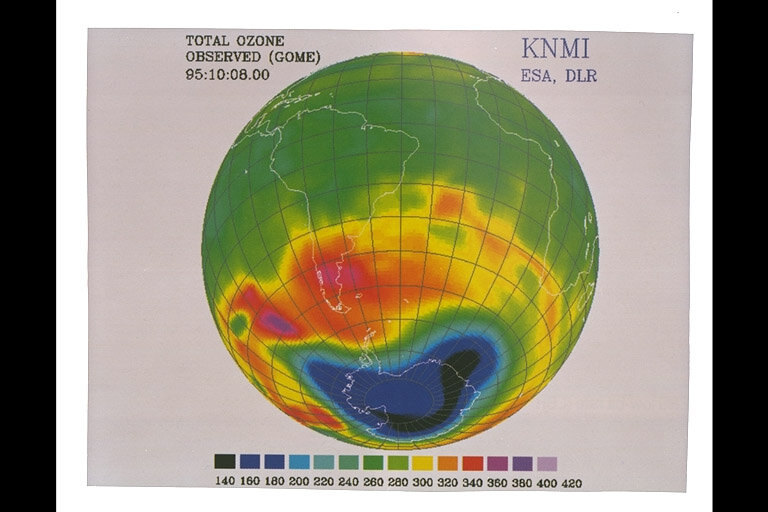
| GOME - Global Ozone Monitoring Experiment | A nadir-scanning ultraviolet and visible spectrometer for global monitoring of atmospheric Ozone; since summer 1996, ESA has been delivering three-day GOME global observations of total ozone, nitrogen dioxide and related cloud information. |
| MWR - Microwave Radiometer | Measures the integrated atmospheric water vapour column and cloud liquid water content, as correction terms for the radar altimeter signal. |
| SAR - Synthetic Aperture Radar | Provides two-dimensional spectra of ocean surface waves. In image mode the SAR provides high resolution two-dimensional images with a spatial resolution of 26 m in range (across track) and between 6 and 30 m in azimuth (along track). Image data is acquired for a maximum duration of approximately ten minutes per orbit. |
| WS - Wind Scatterometer | Obtains information on wind speed and direction at the sea surface for incorporation into models, global statistics and climatological datasets; operates by recording the change in radar reflectivity of the sea due to the perturbation of small ripples by the wind close to the surface. |
| PRARE - Precise Range And Range-Rate Equipment (no longer used) | A compact, space-borne, two-way, two-frequency microwave satellite tracking system. |