Tools to study the distribution of matter in the Universe
How is the distribution of matter in the Universe described mathematically?
What is the power spectrum?
What is the power spectrum of the distribution of matter in the Universe?
Why are cosmologists interested in the power spectrum of cosmic structure?
What was the distribution of the primordial fluctuations?
How does this relate to the fluctuations in the CMB?
How is the distribution of matter in the Universe described mathematically?
On very large scales, matter in the Universe is arranged in a wispy network consisting of huge clusters of galaxies, linked to one another by dense filaments of gas and invisible dark matter and interspersed with gigantic cosmic voids: this network of structure is called the 'cosmic web'. Cosmologists investigate how this complex network of structure formed and evolved, but structure in this cosmic web covers enormous distances – up to billions of light-years and even more – making this task extremely complicated. The closest proxy to a 'bird's eye view' of the large-scale distribution of matter in the Universe is a statistical tool called the power spectrum, which tells cosmologists the ratio between more and less massive cosmic structures overall in the Universe.
What is the power spectrum?
A power spectrum is a mathematical function that can be used to describe the distribution of a quantity (any quantity) in space. This concept can be illustrated by considering a city with a variety of buildings in it and assessing the different types of people that live in each type of building. A survey like this might start with counting how many buildings there are of each size: how many one-family houses, how many two-family houses, how many skyscraper blocks, and so on. It doesn't matter if, on an individual street, there is a tiny one family house nearby a huge apartment block – what matters is how many of each size of buildings there are in the overall architecture of the city, to study how this influences the behaviour of the population. Plotting the number of buildings as a function of their size is an example of what it means to ‘measure the power spectrum’ of the city's urban development.

Access the video
What is the power spectrum of the distribution of matter in the Universe?
When cosmologists study the formation and evolution of cosmic structure in the Universe, they do something very similar to the analysis of the city's urban structure: they plot the relative number of cosmic structures on different sizes in a power spectrum. The shape of this graph reveals the ‘power’ of structures that populate the Universe on each scale. For example, there may be very few structures at very large scales. But counting all of these very large structures’ contributions together gives a measure of their cumulative power. If the power is to be matched with only smaller structures, a much larger number of them are needed.
Why are cosmologists interested in the power spectrum of cosmic structure?
Cosmic structures – stars, galaxies, galaxy clusters – grow under the influence of gravity, which causes them to become denser and denser. However, other forces may act against the attractive pull of gravity; for example, the expansion of the Universe or radiation pressure – the pressure force exerted by photons. Every structure that we observe in the Universe is the result of the balance between all these effects. To understand how exactly all of these structures emerged from the almost smooth distribution of matter in the early Universe, it is important to know how many structures of each size there are in the Universe at the present epoch, and how many there were at past times in cosmic history – a piece of information that is summarised in the power spectrum.
What was the distribution of these primordial fluctuations?
The simplest model of inflation predicts that, at the end of this phase of accelerated expansion, the fluctuations present in the density of matter are such that their contribution is almost independent of their scale. This means that the cumulative power of all fluctuations of a given scale is the same. Taking the example of the size of buildings in a city, this would mean that, if there is a given number of large apartment blocks, there should be a higher number of smaller, double-family houses and an even higher number of even smaller, single-family houses, to keep the buildings on all scales having the same ‘power’, that is, equal numbers of people living in each kind of structure.
If fluctuations in the distribution of matter in the primordial Universe have equal power on all spatial scales, cosmologists say that their power spectrum is 'scale-invariant'. This is characterised with a parameter known as the spectral index, n_s. For a perfectly scale-invariant spectrum, n_s = 1. If n_s is smaller than 1, it means that fluctuations on larger scales are dominant, since they are more abundant (in terms of their cumulative power) than those on larger scales; vice versa, if n_s is larger than 1, fluctuations on small scales are the dominant ones.
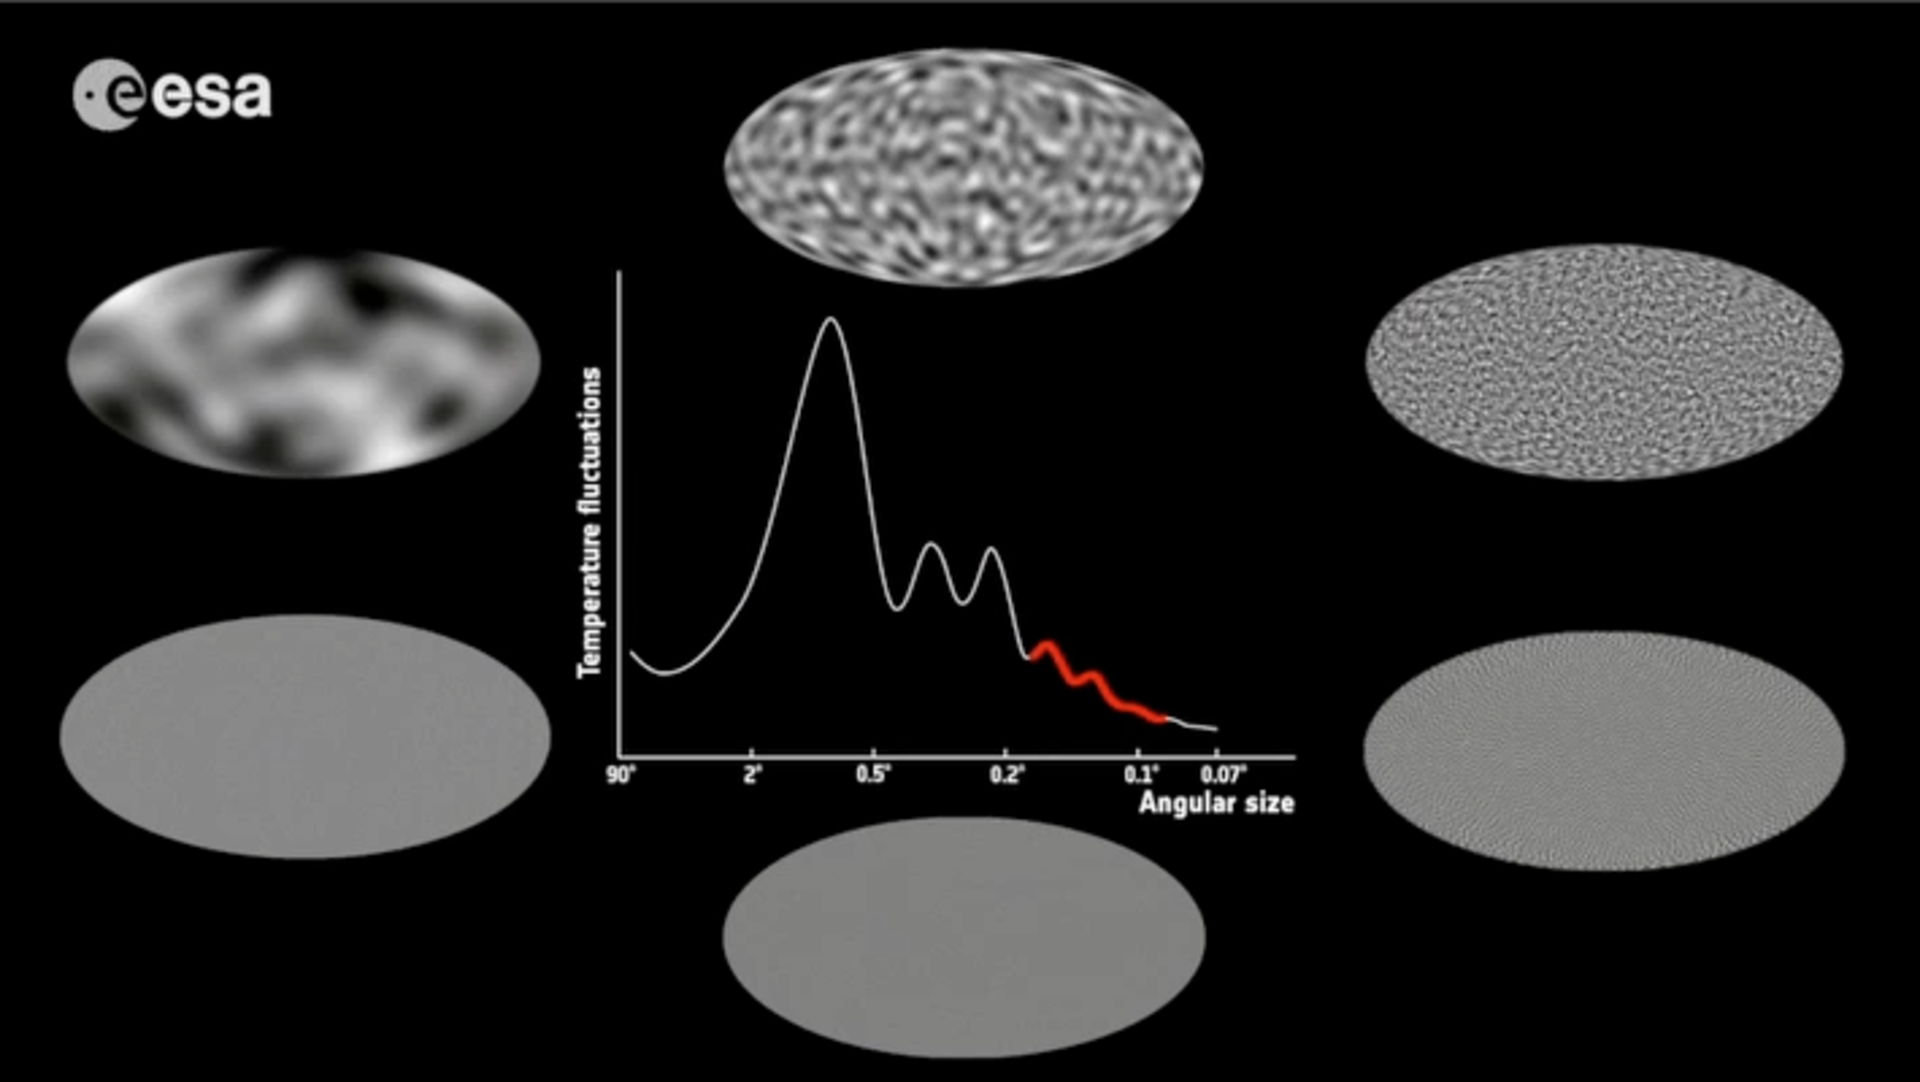
How does this relate to the fluctuations in the cosmic microwave background?
The fluctuations in the temperature of the cosmic microwave background (CMB) are a snapshot of the distribution of matter at a much later cosmic epoch than inflation, as they date back to 380,000 years after inflation ended. In the meantime, the distribution of matter (the power spectrum) at small scales has been modified, but at very large scales an imprint of the original power spectrum that derives from inflation is still present. In particular, CMB fluctuations on very large scales carry information about the primordial spectral index n_s and allow cosmologists to constrain the distribution of fluctuations as it was at the time of inflation. Furthermore, by measuring the spectral index and how much it is different from n_s =1, cosmologists can learn how long the phase of inflationary expansion lasted and how it ended, before the slower expansion rate began. The end of inflation is a particularly interesting epoch in cosmic history, because it is at this time that particles of matter were created for the first time.