Street-level London air pollution warnings coming via mobile phones
The air pollution in Central London and the London borough of Croydon is being forecast daily as part of a pioneering ESA-backed project.
Around a thousand asthma sufferers and other vulnerable individuals in Croydon should soon receive text message warnings to their mobile phones before elevated air pollution days, with additional patients in other London boroughs receiving the service later on.
The YourAir service predicts levels of the pollutants nitrogen dioxide, ozone and airborne particles – exposure to which can harm people with asthma, lung and heart problems, and in the very highest concentrations can harm otherwise healthy people.
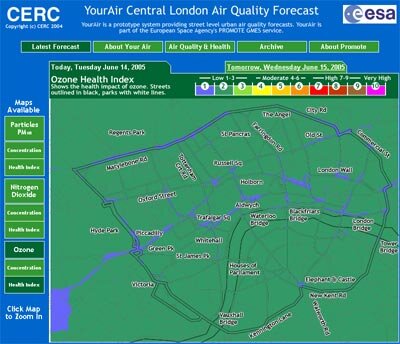
The forecasts include predictions of overall effects on health on an index from one to ten. Unlike previous systems, YourAir resolves air pollution down to the scale of individual streets – highest levels are often found along routes with heavy traffic or other pollution sources, so information on street-by-street changes in pollution help vulnerable people make informed choices about their travel routes.

The prototype service covers Central London and Croydon in South London. Croydon is one of the largest boroughs by area and the largest by population, with 330 000 residents.
YourAir is being developed by Cambridge Environmental Research Consultants (CERC) as a demonstration service of ESA's PROMOTE project, intended to deliver atmospheric information to support informed decision making in this field and improve quality of life.
PROMOTE is itself part of Global Monitoring for Environment and Security (GMES), a joint initiative between ESA and the European Union to integrate all available space- and ground-based information sources to develop an independent European environmental monitoring capacity from planetary to local scales.
"The YourAir service works by combining data from the various sources available," said Iarla Kilbane-Dawe of CERC. "It combines regional air quality forecasts provided by PROMOTE with information on local road traffic patterns.
"We also employ information from monitoring stations around the city. Because their coverage is limited they don't help with generating forecasts, but serve as a key way of validating our results, which so far have been around 90% accurate. For the next stage of the project we aim to improve the accuracy further by integrating other data sources, especially satellite observations and more data on traffic patterns."
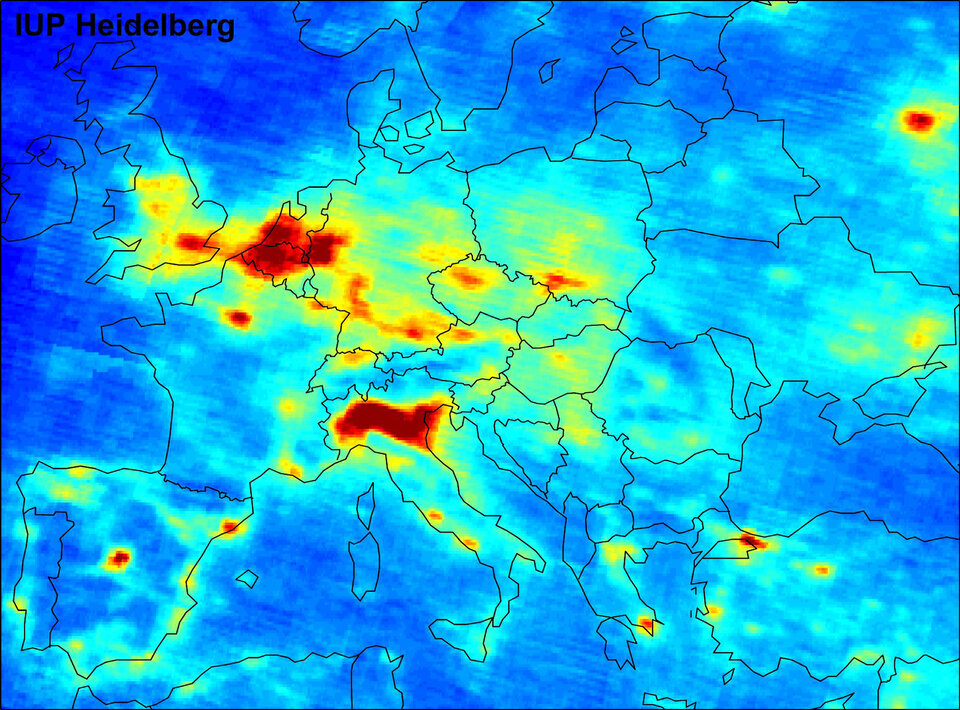
Regional air quality information is important because not all the pollution affecting a city actually originates there. Depending on the weather, studies show that up to half the air pollution found in some European cities might have come from elsewhere in the continent – the Ruhr in Germay for instance, or as far away as Italy's Po Valley.
Satellite-based atmospheric sensors such as Envisat's Scanning Imaging Absorption Spectrometer for Atmospheric Chartography (SCIAMACHY) can monitor such transboundary movement of air pollution, and so provide constraints for the model used for air pollution forecasts, increasing their accuracy.

"With air pollution arising, its distribution drops off steeply away from major roads or other sources because it mixes vertically as well as horizontally," Kilbane-Dawe explained. "On most days the air rises, taking the pollution with it – as high as 800 metres in the winter, or two kilometres in the summer. So within an hour or so of rush hour the concentrated pollution can waft away."
Some of the highest pollution levels occur when the meteorological situation means local pollution remains trapped close to the ground, combined with pollution plumes from elsewhere.
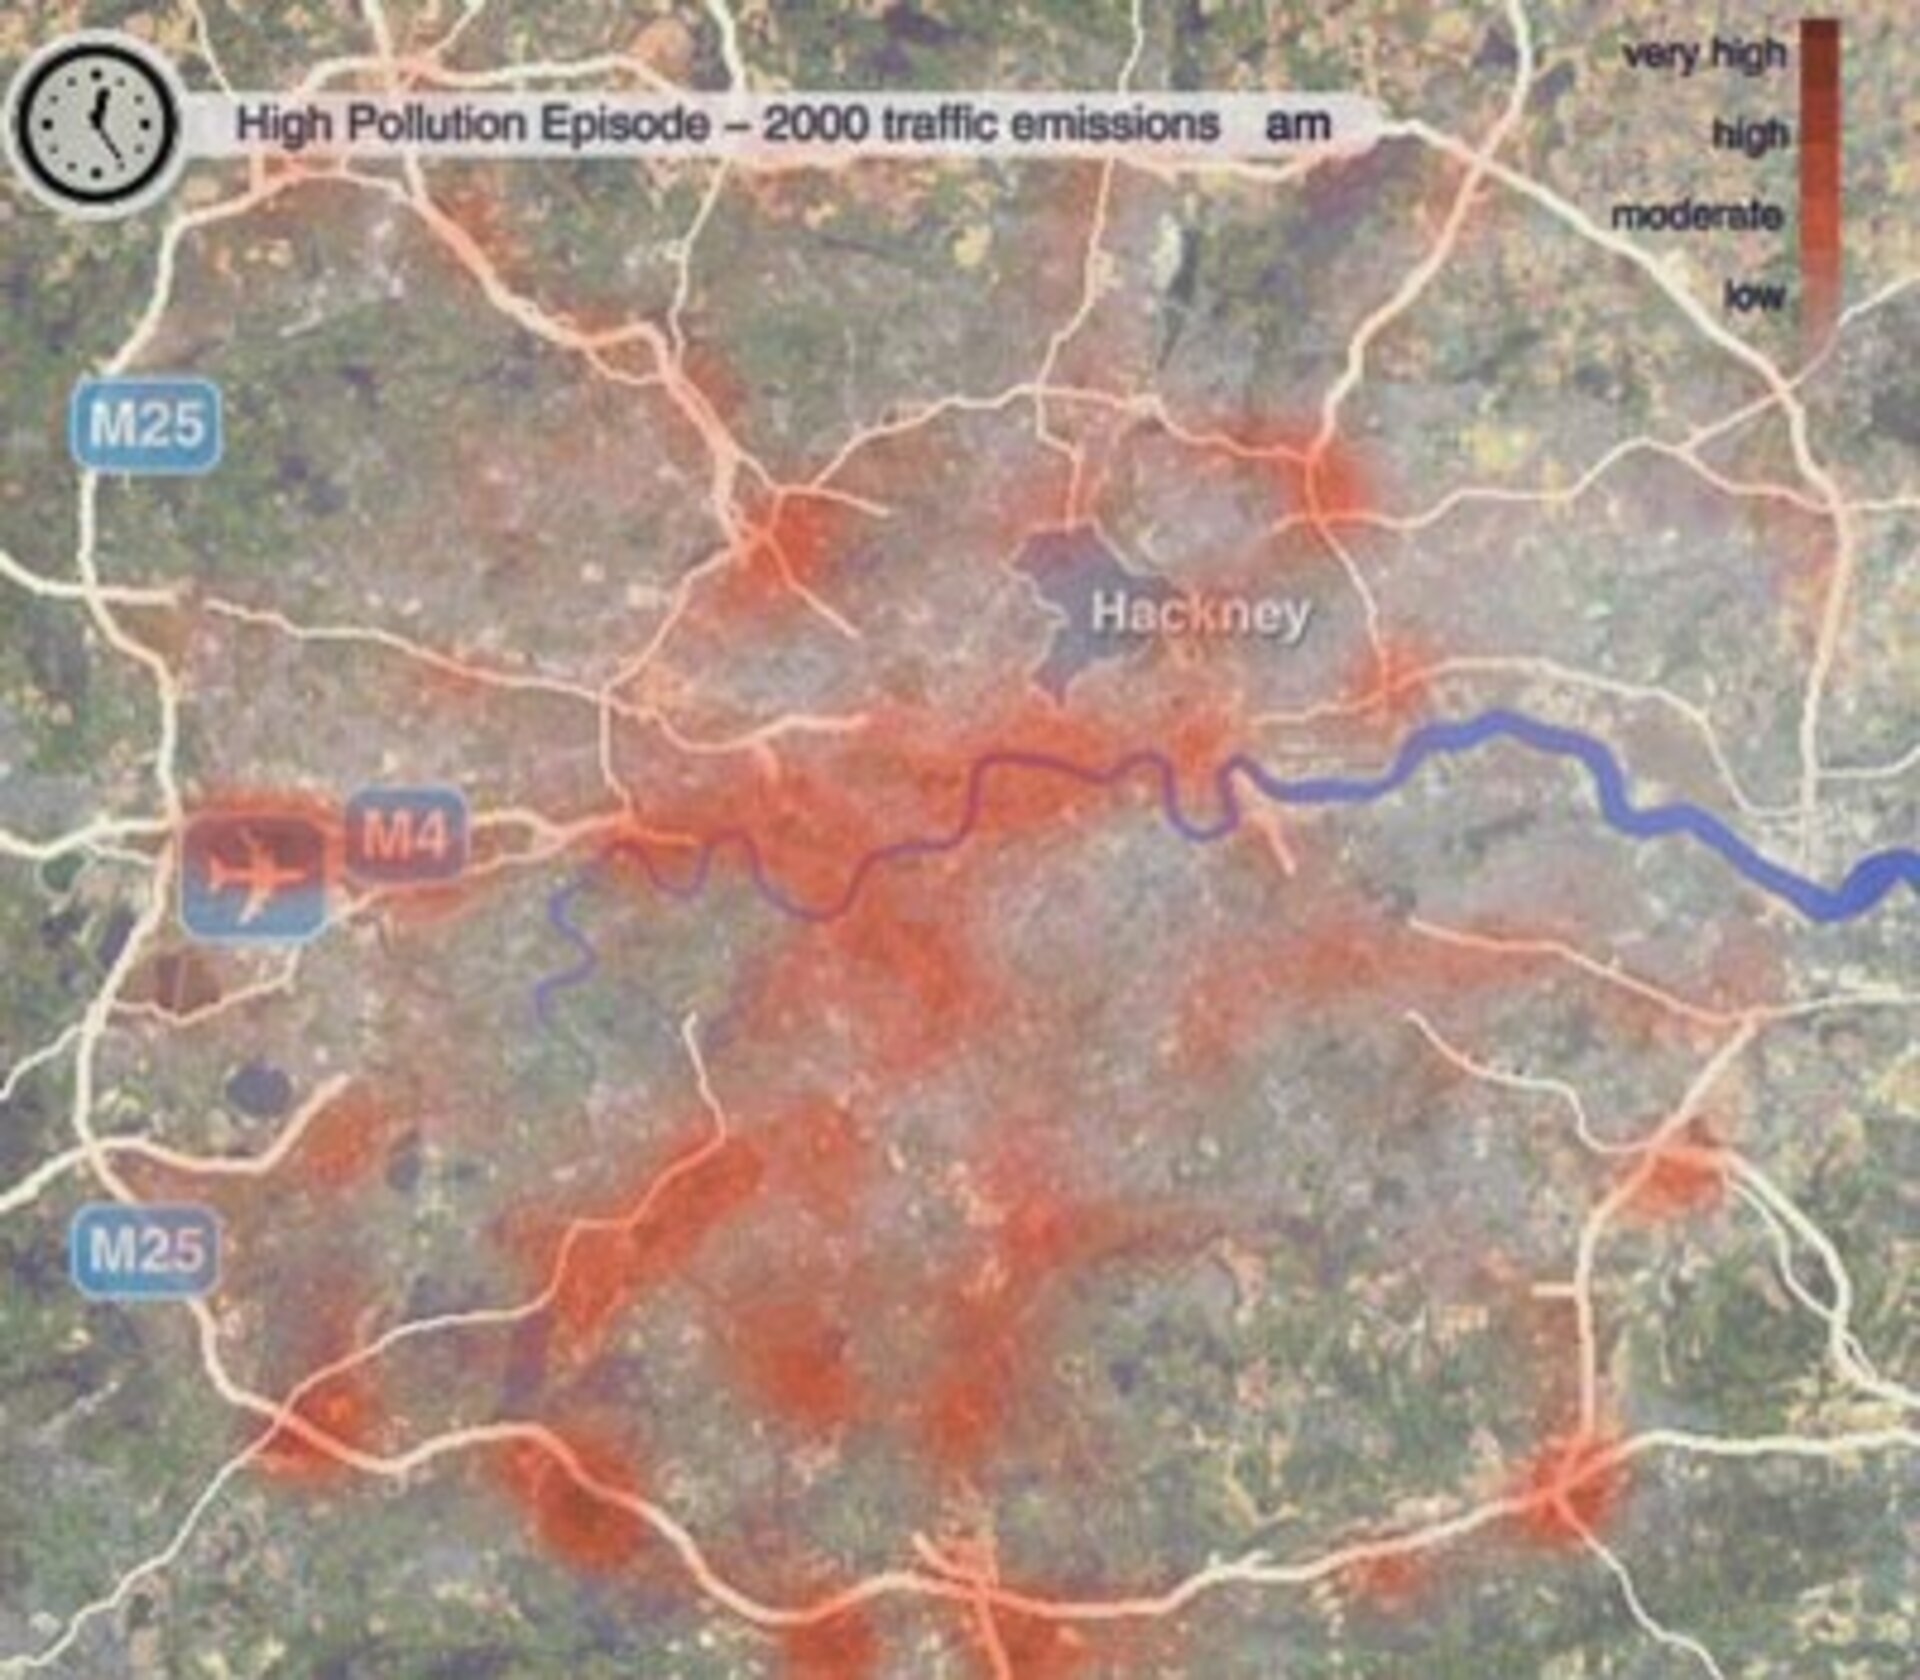
In the case of London this happens most often during the winter – the animation above shows citywide pollution patterns during the 24 hours of 15 November 2000, when such a high pollution event took place.

"This animation was created by us for the Building Exploratory, an interactive exhibition in the London borough of Hackney," Kilbane-Dawe added. "The traffic data used to generate this animation isn’t yet available in real time - the animation includes detailed data from all 31 London boroughs - but it illustrates well the way pollution can concentrate near major roads and follows traffic patterns, and it demonstrates what we expect will become a routine type of urban air quality forecast within a few years."
A linked project called airTEXT involves sending a text message to the mobile phones of a thousand vulnerable individuals during the evening before days when air pollution may be moderate or high. The message will also advise on steps they can take to minimise their pollution exposure and manage their symptoms.
Also backed by PROMOTE, AirTEXT is a partnership between CERC, Croydon Council, the Croydon Primary Care Trust and the South West London Health Protection Unit.
PROMOTE and GMES
PROMOTE is an ESA project that seeks to develop beneficial operational services for organisations and citizens that will use atmospheric data to address the concerns of both policymakers and individual citizens.
The four areas in which PROMOTE services are being developed are air quality, stratospheric ozone, UV exposure and climate change. Partners in the PROMOTE consortium include Météo France, the Norwegian Institute for Air Research (NILU) and the Max Planck Institute in Germany.
The project is part of the GMES Services Element (GSE), an initial portfolio of services being developed as part of GMES. This is a joint initiative of ESA and the European Commission designed to establish a European capacity for the provision and use of operational information for Global Monitoring of Environment and Security.