How does interferometry work?
A standard radar satellite image superficially resembles a black and white version of an optical image. But while optical sensors are dependent on reflected light to capture an image, radar sensors send out their own microwave signals in order to 'see' how they backscatter, dependent on relative surface roughness. So one great advantage of radar instruments is that they go on working through local clouds or darkness.
Another advantage of radar is that its signal contains additional useful data, accessible when two radar images of the same site, taken from the same position, are combined together.
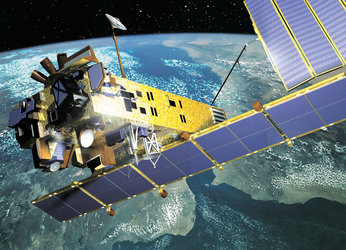
Radar equipment operates at extremely high frequencies and correspondingly low wavelength – just 5.6 centimetres in the case of ASAR, meaning a complete cycle through a signal wave occurs for every 5.6 cm of distance.

The division of the total distance the ASAR signal travels – from space to Earth and back again – by its wavelength determines at what fraction along the peak or trough of a wave the returning signal will be, a detectable value known as the signal 'phase'.
If the same target on Earth is re-acquired from the same point in space, then in theory the total signal distance will be unchanged and the signal phase should remain the same.
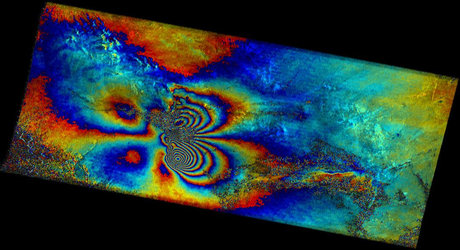
However the slightest millimetre-scale ground shift occurring between acquisitions will cause the phase to alter. Just like sets of ripples meeting in water, the combination of radar signals that have different phases sets up interference patterns - hence the term 'interferogram'.
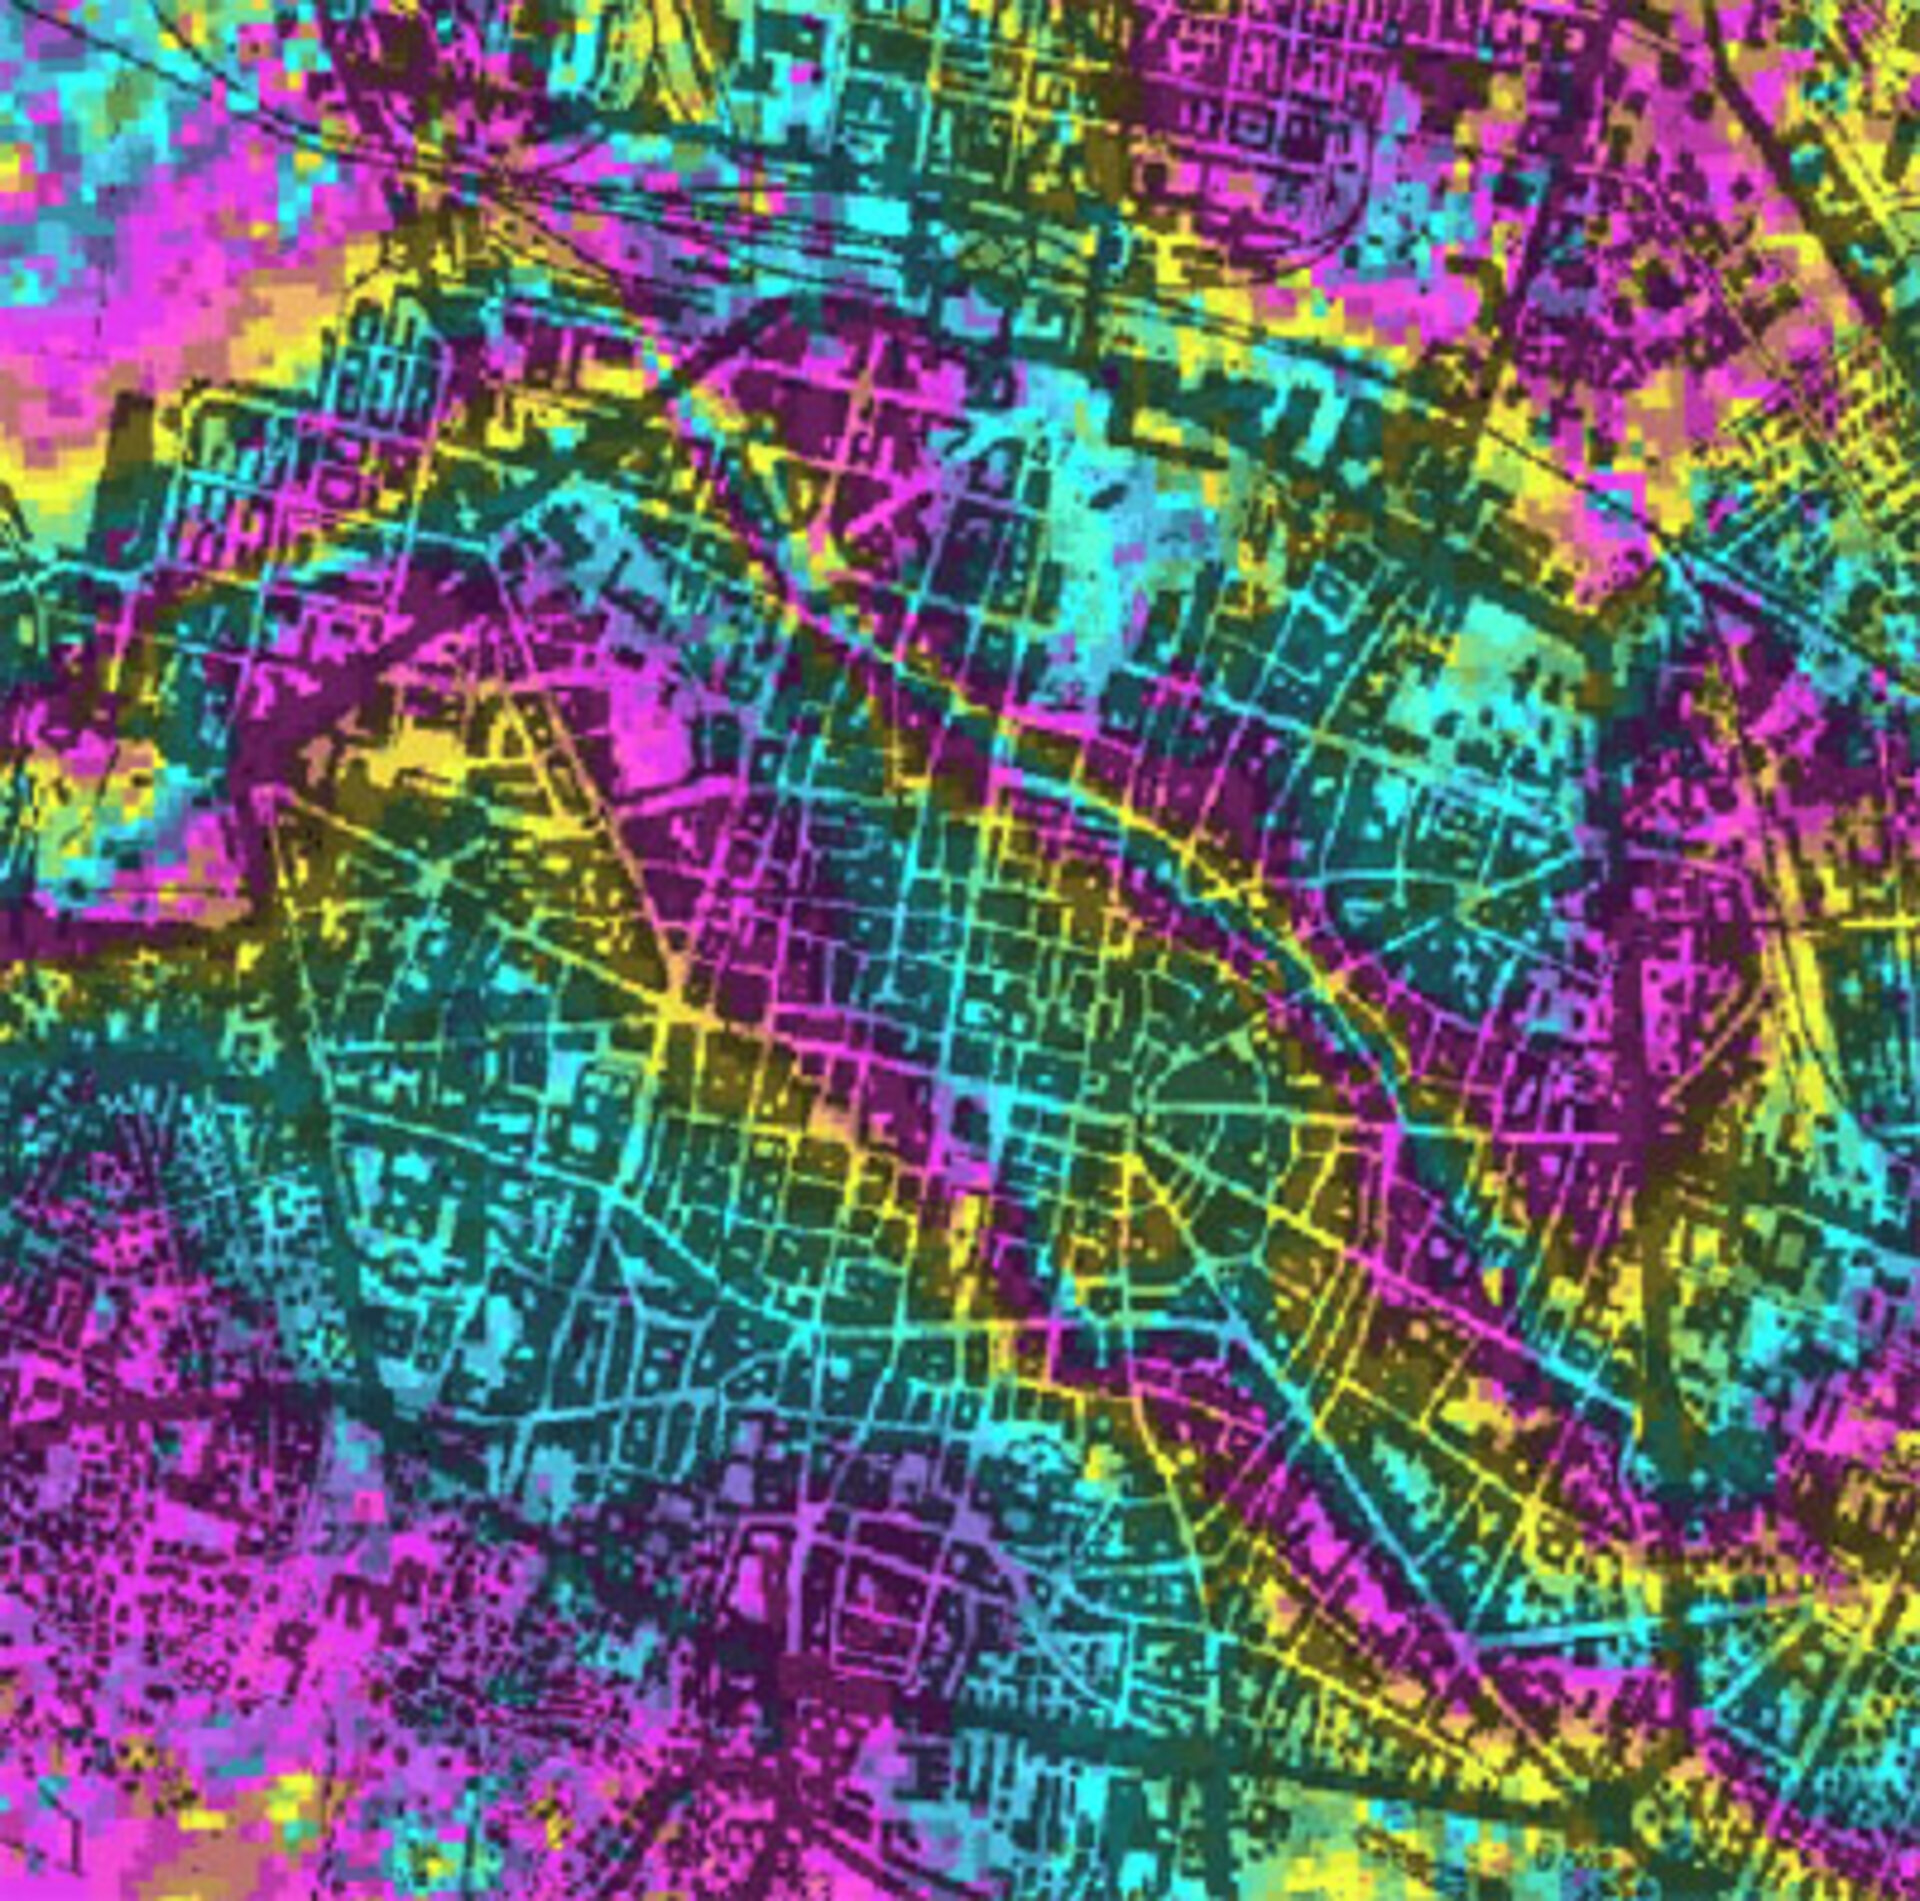
Successful paired-image (or multiple-image) interferograms can reveal changes in a landscape across a wide area to an extraordinarily high degree of detail. To look at they resemble the iridescent rainbow swirls you see on the surface of soap bubbles or a thin film of oil on water – which are actually optical interference patterns from light being reflected together.

The coloured fringes seen in a given InSAR image can be regarded like contour lines on a map – except on a vastly reduced scale. One complete set of coloured bands represents ground movement relative to the spacecraft of half a wavelength, 2.8 cm in the case of ASAR.
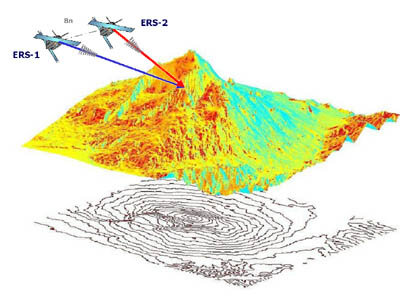
InSAR practice is a little more complicated than theory, since it is difficult for satellites (though even more difficult for radar-carrying aircraft) to precisely revisit the same vantage point. Slightly different perspectives on the same landscape can cause phase shifting due to apparent variations in surface elevation.

This effect is similar to the way overlapping pictures can appear stereoscopic using 3-D glasses. InSAR is therefore often used to derive height elevation and create an accurate digital elevation model (DEM) of a landscape.
To measure millimetre-scale ground shifting however, a technique strictly known as differential interferometry (D-InSAR) must be employed. This involves the removal from the interferogram of topographic effects by use of a DEM, which can be performed if the distance between the acquisition viewpoints – called the baseline – is less than about a kilometre.

And for added accuracy any atmospheric variation between acquisitions is often also taken account of. This process of subtraction means any remaining interference patterns are solely due to ground movement taking place between acquisitions.
There is one fairly fundamental limitation on interferometry; a requirement that the collection of numerous small reflective surfaces forming the landscape maintains consistent between acquisitions.

Events such as the growth of vegetation, wind scattering leaves, or rainfall smoothing out soil can stop InSAR images from properly matching up, or correlating, and the longer the timespan between acquisitions, the more this is likely to occur.
However proposed radar sensors based on a longer signal wavelength – such as the L-band used with the GPS navigation system, due to be employed by the forthcoming Japanese ALOS (Advanced Land Observing Satellite) or the TerraSAR-L mission currently under study as part of ESA's EarthWatch programme – would have the ability to 'see' through vegetation cover, snow or small stones or soil to widen the suitability of InSAR across more varied terrain, with a slight trade-off in image resolution.