The power of two: Envisat demonstrates combined imagery from dual sensors
The simultaneous observation of the Italian coast by two instruments onboard the European Space Agency’s Envisat satellite provides a striking illustration of the unique potential of combining sensor data for a better understanding of complex Earth processes.
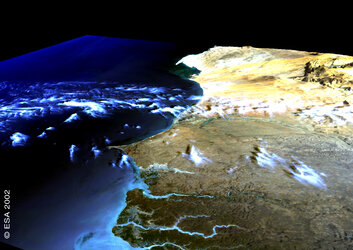
Envisat’s Advanced Synthetic Aperture Radar (ASAR) and the Medium Resolution Imaging Spectrometer (MERIS) sensors acquired the images in June. They show a small low-pressure weather front passing between the French island of Corsica and the Italian peninsula.
The centre of the depression is visible as a dark area in the ASAR image because of low wind speeds at the centre of the system and the corresponding reduction in sea surface roughness. This is confirmed by the MERIS image, which shows the cloud pattern associated with the depression.
By combining the two datasets for a given region, small-scale processes that could not be properly interpreted by data from a single sensor can be properly analysed by incorporating the data from a second instrument. The spatial resolution and constraints on observing conditions applicable to MERIS, for instance, can limit the capability of the instrument to systematically register the full range of oceanographic processes in a given area. At the same time, the imaging capabilities of the ASAR may require the availability of supporting data to ensure correct interpretation of all phenomena observed.
ASAR/MERIS data correlates for enhanced analyses

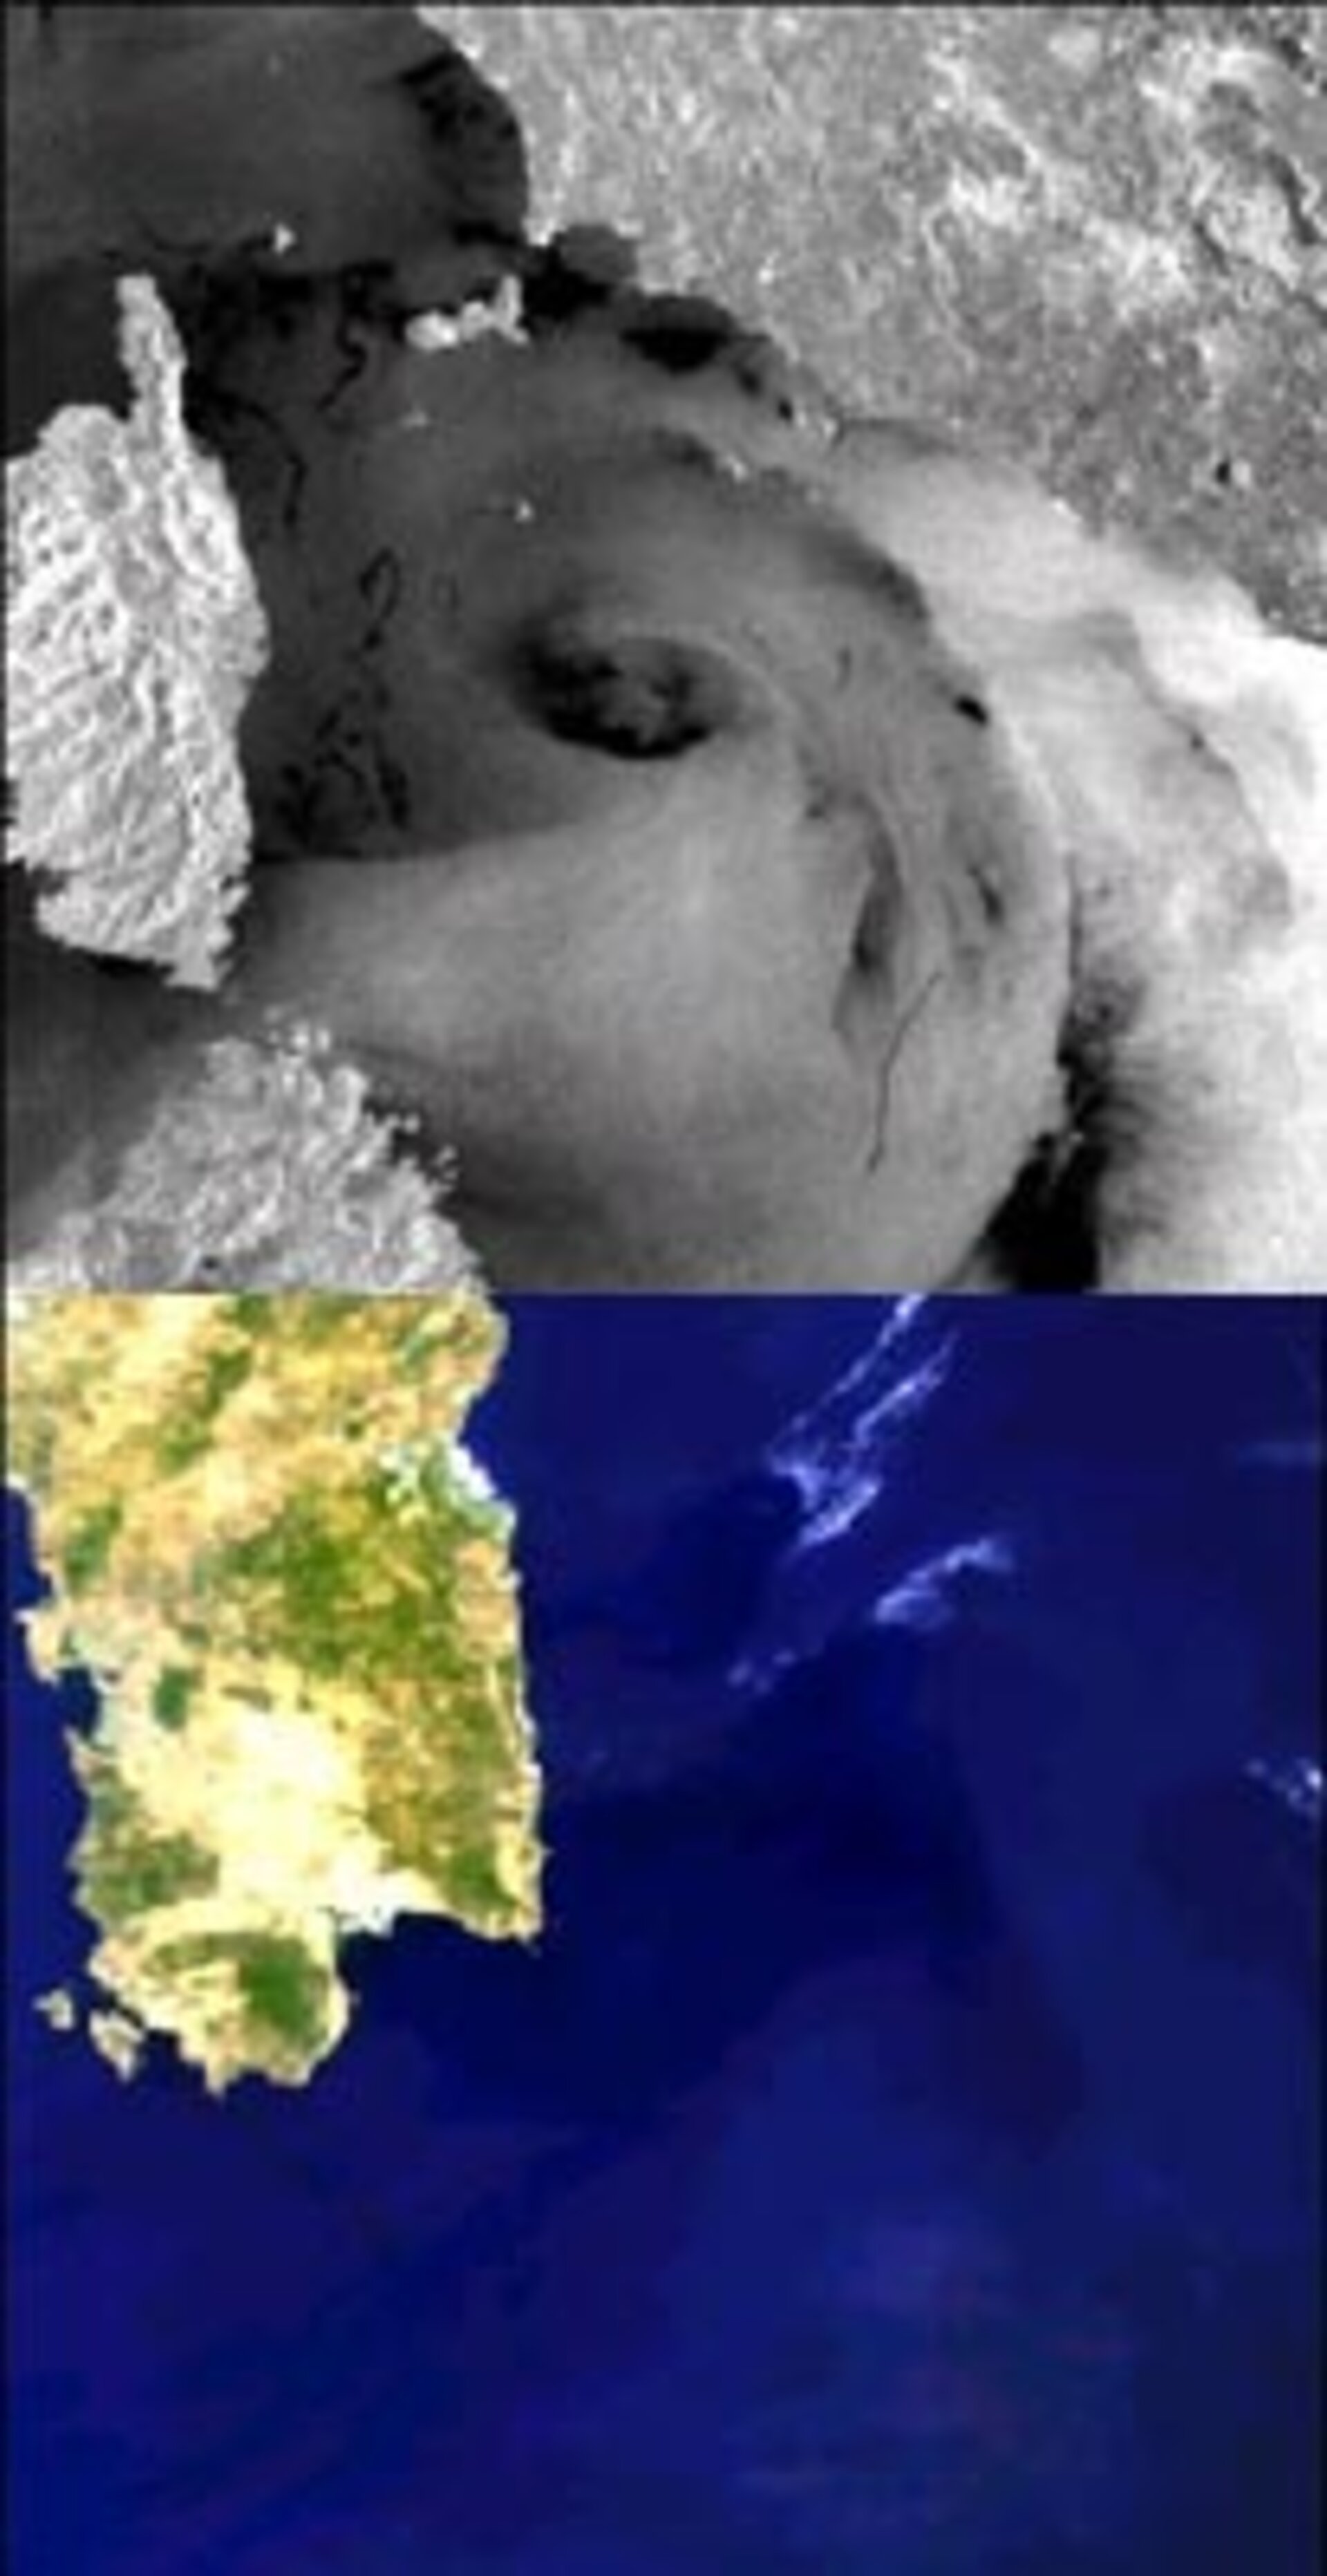
As seen in the image of the weather system off the Corsican coast, the MERIS data provides valuable contextual information in the identification of the ocean surface effects associated with the passage of a depression system.
The correlation between the cloud patterns observed in the MERIS image and the structure observed in the ASAR image is remarkable. For example, between southern Corsica and the depression centre, a distinct change in surface wind speed can be determined on the ASAR image due to the sudden variation in tone. This is the surface impact of an atmospheric front that can be easily seen in the MERIS image from the associated cloud band. The change in tone relates to the increase in surface roughness moving south through the image – the cold air north of the front ensures greater atmospheric stability close to the sea surface and, hence, lower surface wind speeds. Warmer air on the other side of the front generates lighter colours due to the higher wind speeds.
A more striking example is the degree of correlation for a wind front structure to the east of the depression centre. The surface impact of atmospheric convention patterns is visible in the ASAR image (the dark mottled pattern). This is linked to the outer cloud band seen in the MERIS image.
The large bank of cloud observable in the MERIS image at the southeastern end of the depression’s centre has a corresponding change in the tone of the ASAR image. Small dark patches seen on the sea surface in the ASAR image may be due to the effect of rain cells, although these are very limited. This is close to an area of thick cloud cover.

A larger rain cell system is seen behind the long line of cloud cover. This shows up as a small patch of cloud on the MERIS image and as a small dark patch on the ASAR image. The local reduction in backscatter measured by the ASAR over a rain cell is due to the rain causing local turbulence, which damps out the surface waves that would otherwise reflect energy back in the direction of the ASAR. In the combined image, rain areas show up as bright red indicating high MERIS reflectance and very low ASAR backscatter.
Other dark areas in the image are the result of different processes. For example, in one patch northwest of the island of Elba, a ship’s wake can be seen, while no corresponding cloud area can be seen in the MERIS channel. This suggests the presence of a natural film on the sea surface. Other causes of such patches are often areas of lower sea surface temperature, resulting in a more stable air mass immediately above the sea surface and, hence, reduced surface wind stress.
Sensors detect oil dumping
The ASAR/MERIS imagery covers several major shipping lanes, including the main route to Genoa as well as access to a major oil refinery near Cagliari in the south of Sardinia (where several ships can be seen as bright white points in the bay). The long thin dark structures are due to oil dumped illegally by shipping in the area. The presence of oil or natural films damps out the surface waves and reduced the observed backscatter levels.
ASAR wide swath imagery will make a major contribution to improved monitoring of marine areas to prevent such dumping. The image was acquired at approximately 0930 hence most of the dumping probably occurred during the hours of darkness. Due to its operating wavelength, ASAR is able to detect illegal dumping both day and night.
Close analysis of the oil slicks enables detailed characterisation of the wind circulation around the centre of the depression. Between it and Corsica, the oil slicks have been blown southwards. The slicks to the south of the depression have been blown in an easterly direction, while those to the north have been moved to the west. Additional ship targets can be seen in the sea areas around Elba and in the sea-lanes towards Genoa.
The first top-down/bottom-up space view of a hurricane

Using this combination of ASAR and MERIS imagery, scientists now have the opportunity to view from space the top and bottom of a hurricane at the same time.
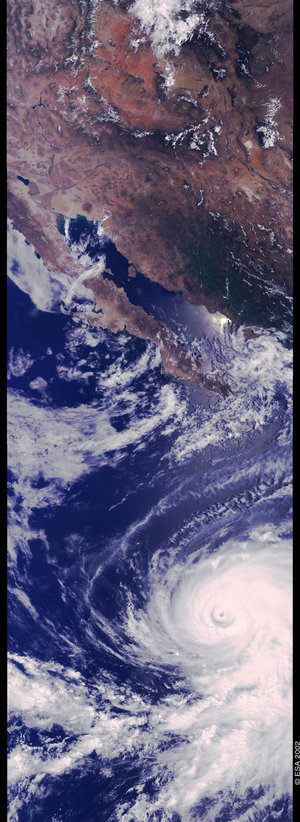
The second set of ASAR/MERIS images shows the recent Hurricane Isidore passing over the Gulf of Mexico last month. The imagery demonstrates how features related to all principal hurricane dynamics can be observed.
Thanks to Envisat’s unique capability to simultaneously acquire MERIS optical and ASAR imagery over the same area of the earth, cloud structure as seen from above the hurricane can be combined with sea surface roughness effects from the hurricane base at unprecedented spatial resolution, a major contribution to improved characterisation of hurricanes.

Important hurricane processes occur at a range of altitudes and locations throughout the system. For example, strong low-level surface winds and bands of intense precipitation combine with strong updrafts and outflows of moist air at higher altitudes, with energy released as thunderstorms. Until now, the only reliable source of such high-resolution measurements at different altitudes was from aircraft flown directly through the hurricane system.
From MERIS, the classical circulation pattern of Isidore can be traced with the cloud structure around the hurricane centre as warm moist air enters the system. The eye of the hurricane can be clearly identified, together with the thick cloud structures associated with the convection within the eye wall. The higher altitude outflow can be seen extending over Cuba as systems of thunderstorms.
From ASAR, the damping of surface roughness can be observed. The bands of intense precipitation are seen as two curves of dark patches extending out around the northern edge in a wide arc and close to the southern side of the hurricane eye. The eye itself can be seen as the low backscatter area in the centre of the system. Additional dark areas close to the coast of Mexico are due to the land generating areas of relative shelter where local wind speeds are reduced and hence sea surface roughness is lower.