
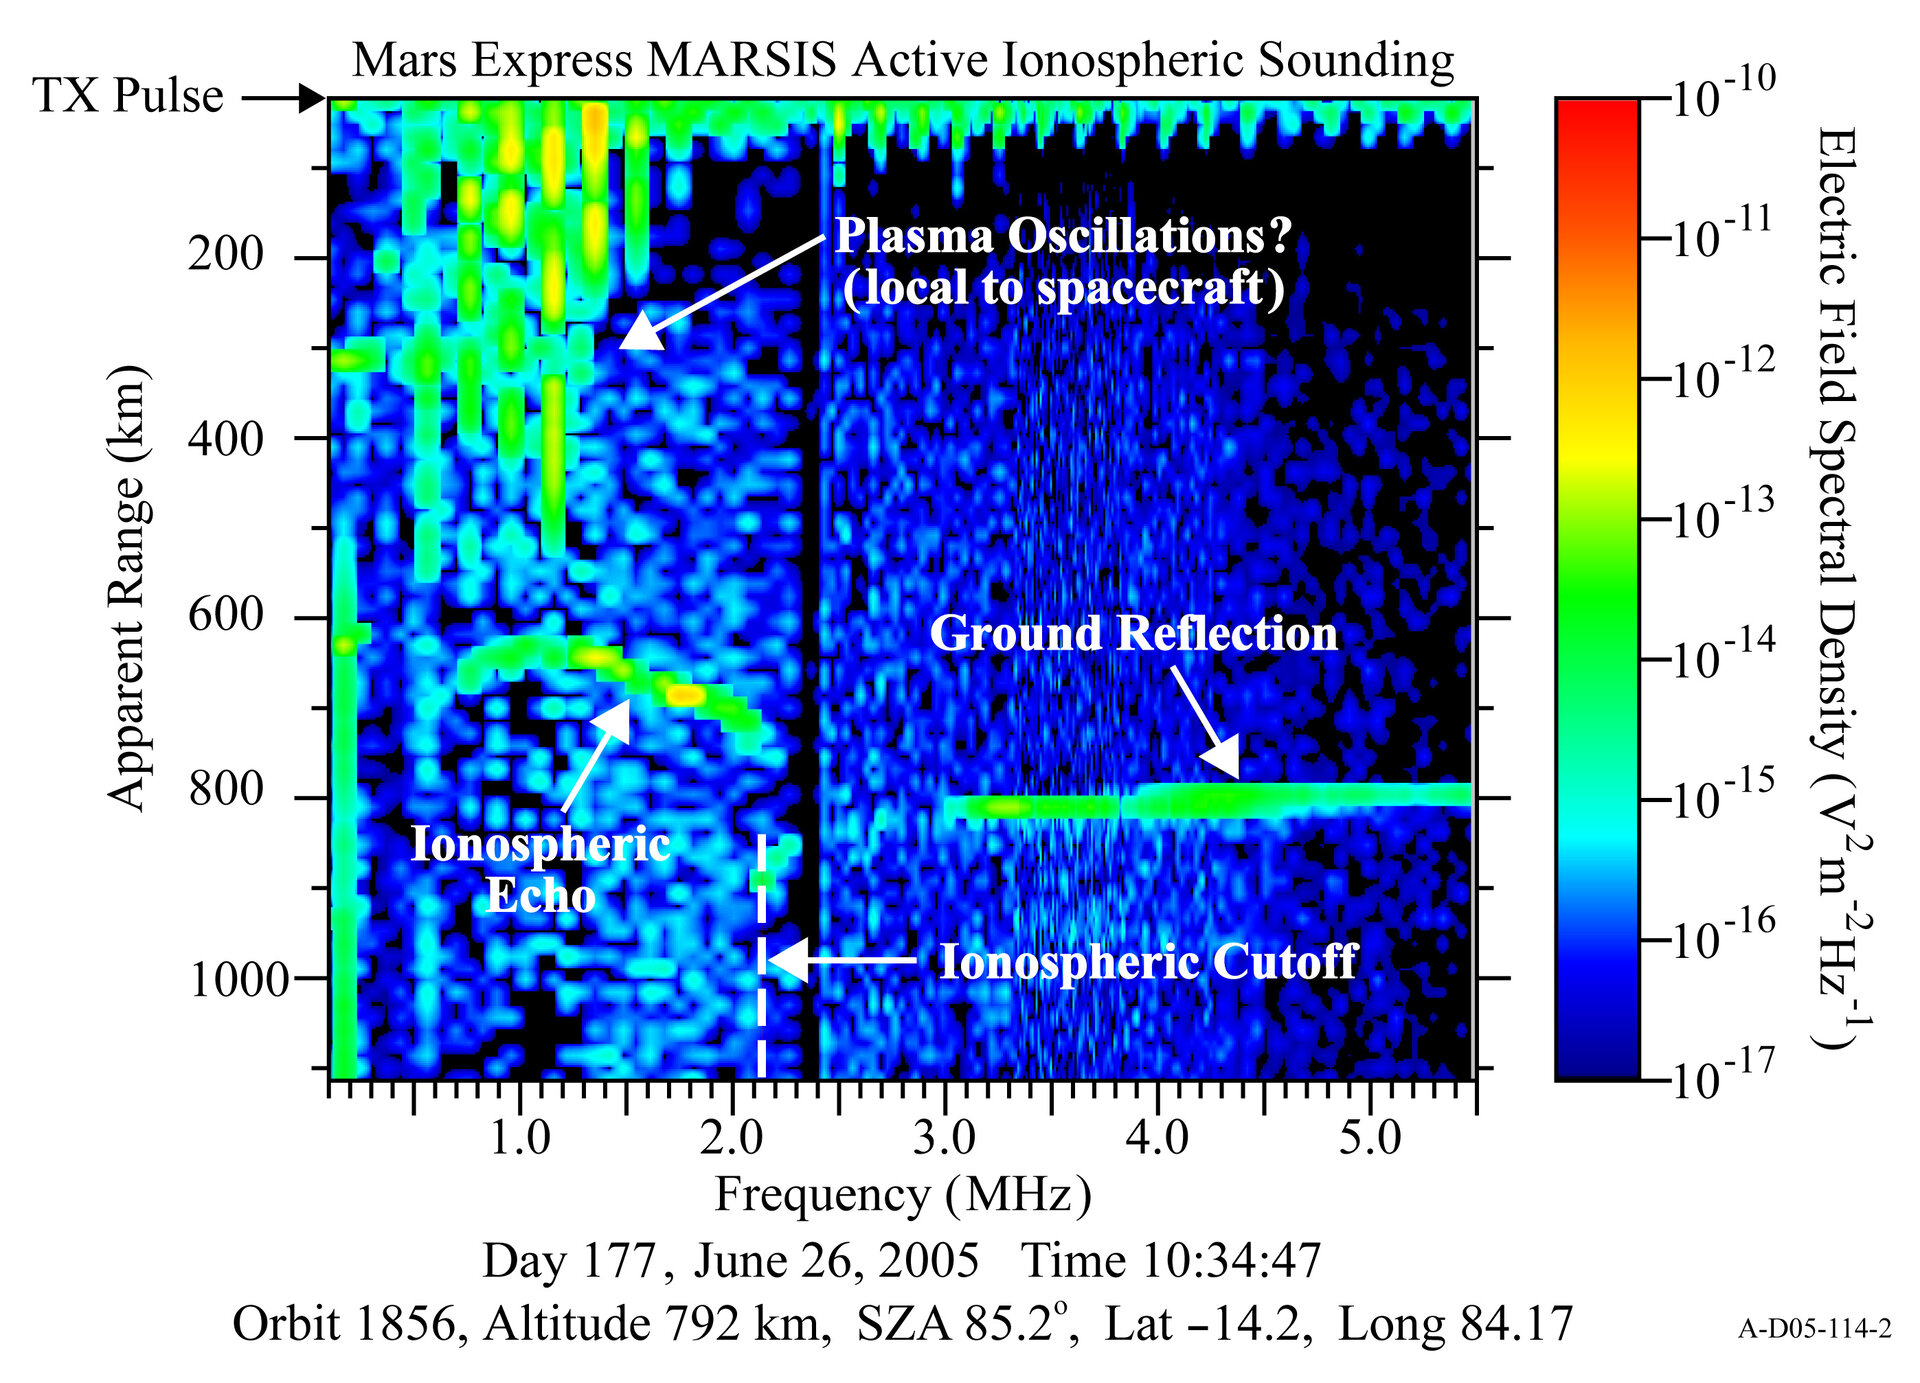
An ‘ionogram’, a typical product of MARSIS ionospheric sounding
In this ‘ionogram’, a typical product of MARSIS Martian ionospheric sounding, the vertical axis (positive downwards) indicates the distance from the spacecraft at which the echo was generated, or equivalently the echo time-delay.
This is displayed for each transmitted frequency, plotted on the horizontal axis. The left side contains information on the ionosphere, while the right side shows data from the surface. The transition between the two displayed areas is determined by the exact conditions of the ionosphere at the time of the measurements, which depends on the solar illumination conditions.
The intensity of the various echo signals detected is indicated in different colours, with dark blue being the least intense and red the most intense. The bright green echo on the right hand side of the image, was produced at a distance of 800 kilometres from Mars Express and indicates the reflection from the surface of Mars. The curved bright green feature on the left hand side of the image, produced at about 600-750 kilometres from Mars Express, is the echo from the top of the ionosphere.
This ionogram was generated on the basis of data collected on 26 June 2005, during the MARSIS commissioning phase. The spacecraft was flying at an altitude of 792 kilometres over Mars, near the sunlight terminator.

Ionosphere Rocket Experiments
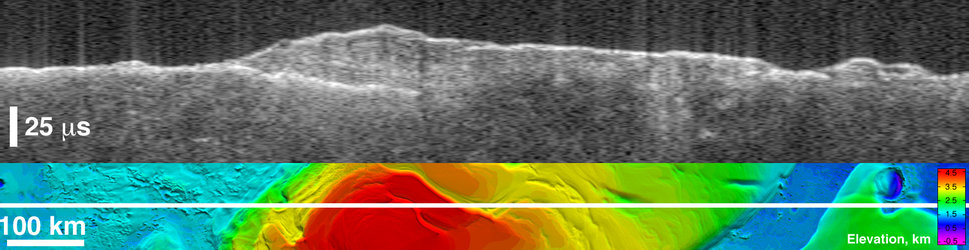
Bright lower echo from Mars’ south-polar layered deposits
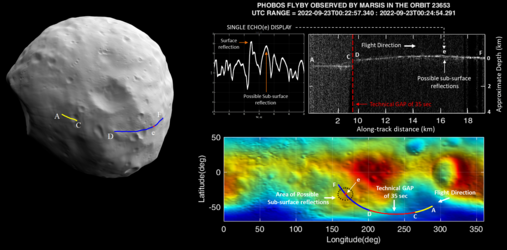
Mars Express peers beneath the surface of Phobos
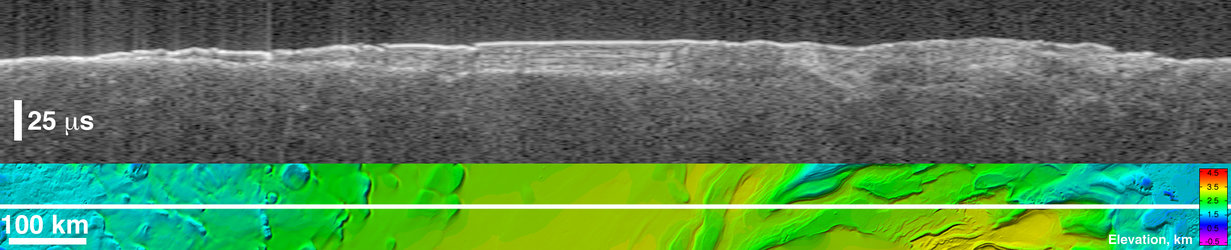
Virtual ‘slice’ through icy layered deposits near Ma…
