Science & Exploration
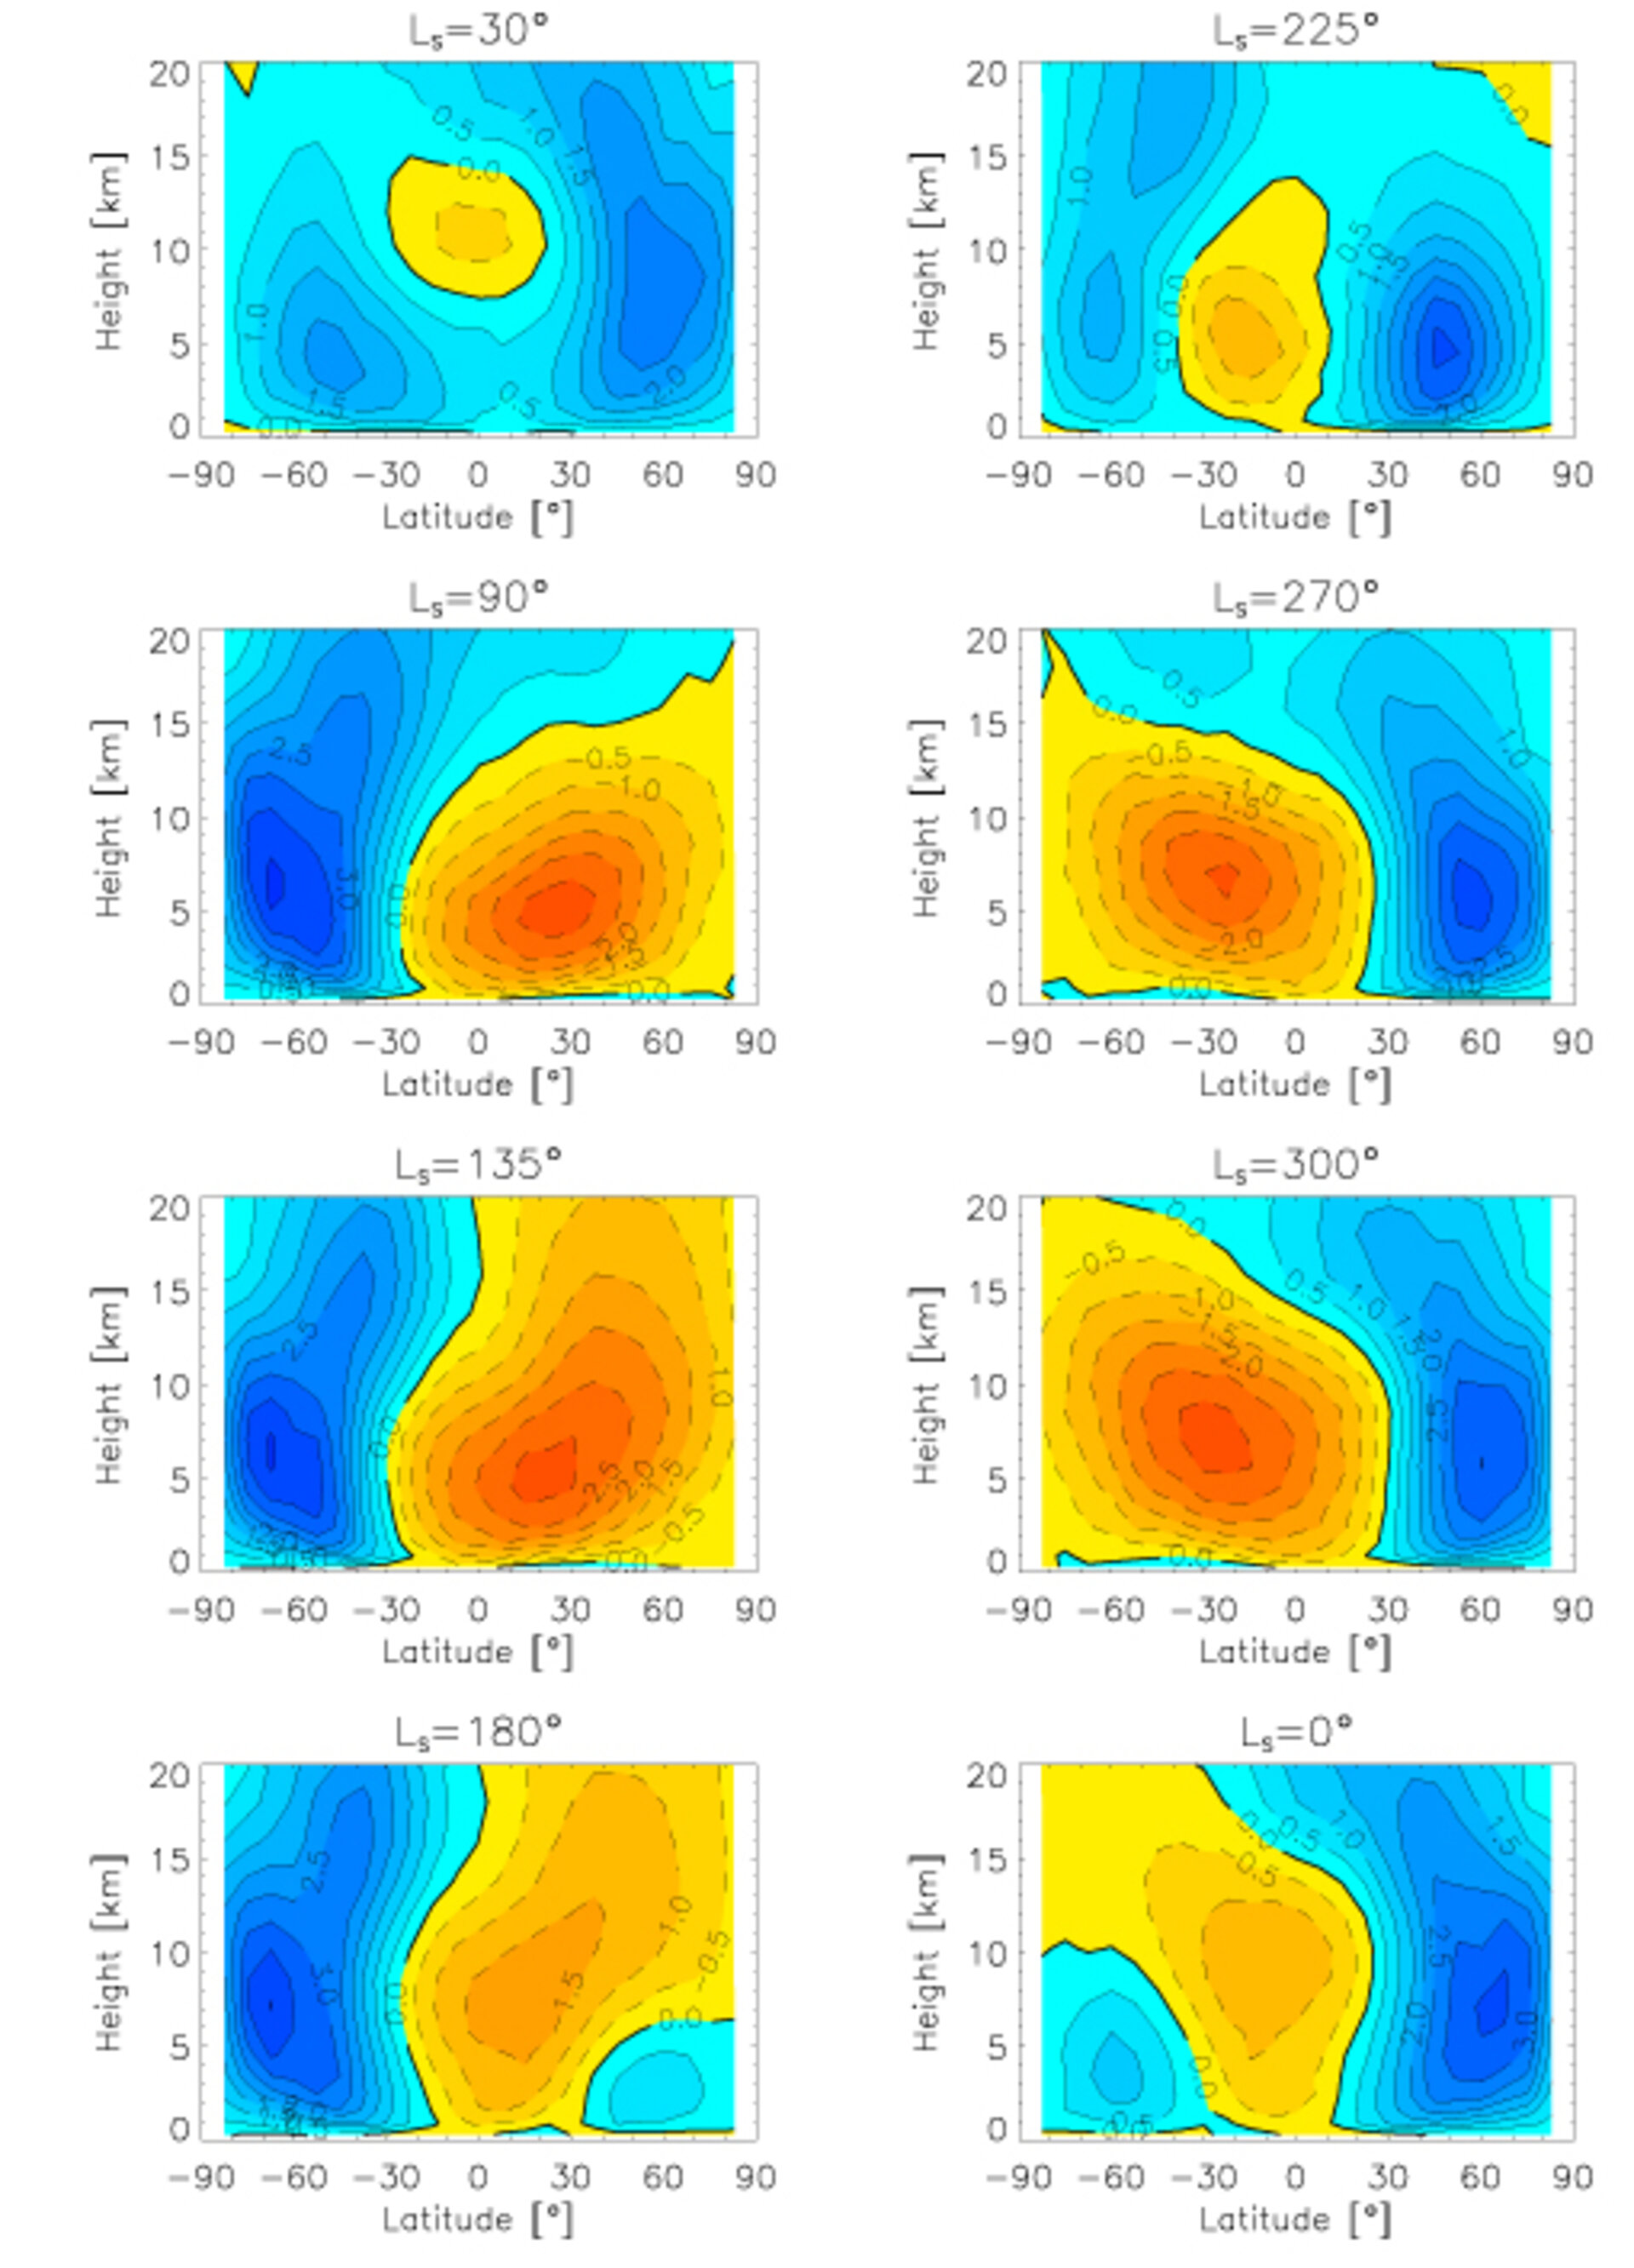
Simulation of zonal wind speed in the lower atmosphere of Titan
: These panels are the result of a simulation run with a Global Circulation Model and based on data gathered by Huygens. They show a vertical cross-section of zonal wind speed in the meridional lower atmosphere (at different altitudes) of Titan, during day time. ‘Ls’ (on the image) is the solar longitude describing the season.