

The Hubble sequence six billion years ago was very different from the one astronomers see today.
The Hubble sequence six billion years ago was very different from the one astronomers see today. The two sections show how many more peculiar shaped galaxies (marked Pec) are seen among distant galaxies, as opposed to among local galaxies. The data organisation follows the Hubble tuning-fork classification scheme invented in 1926 by the same Edwin Hubble in whose honour the space telescope is named.
The top image represents the current — or local — Universe. Three percent of galaxies are elliptical (marked E), 15% lenticular (marked S0), 72% spiral (marked Sa to Sd, or SBb to SBd) and 10% peculiar (marked Pec).
The bottom image represents the make up of the distant galaxies (six billion years ago), showing a much larger fraction of peculiar galaxies. The census found 4% of distant galaxies were elliptical, 13% lenticular (S0), 31% spiral and 52% peculiar. This implies that many of the peculiar galaxies ultimately become large spirals.
These images were created from data that are part of large sky surveys undertaken by the NASA/ESA Hubble Space Telescope and the 2.5 m-diameter telescope at Apache Point Observatory, New Mexico, USA (Sloan Digital Sky Survey).

A green cosmic arc
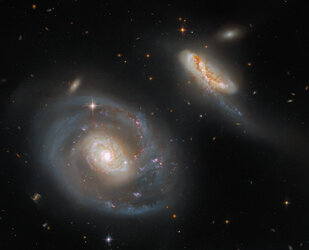
Hubble captures a peculiar galactic pair

Celebrating Hubble’s 32nd birthday with a galaxy grouping
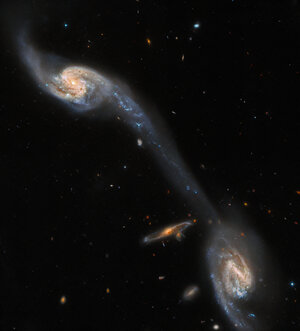
Hubble Inspects A Pair of Space Oddities
