Agency
Sea ice drift over Arctic
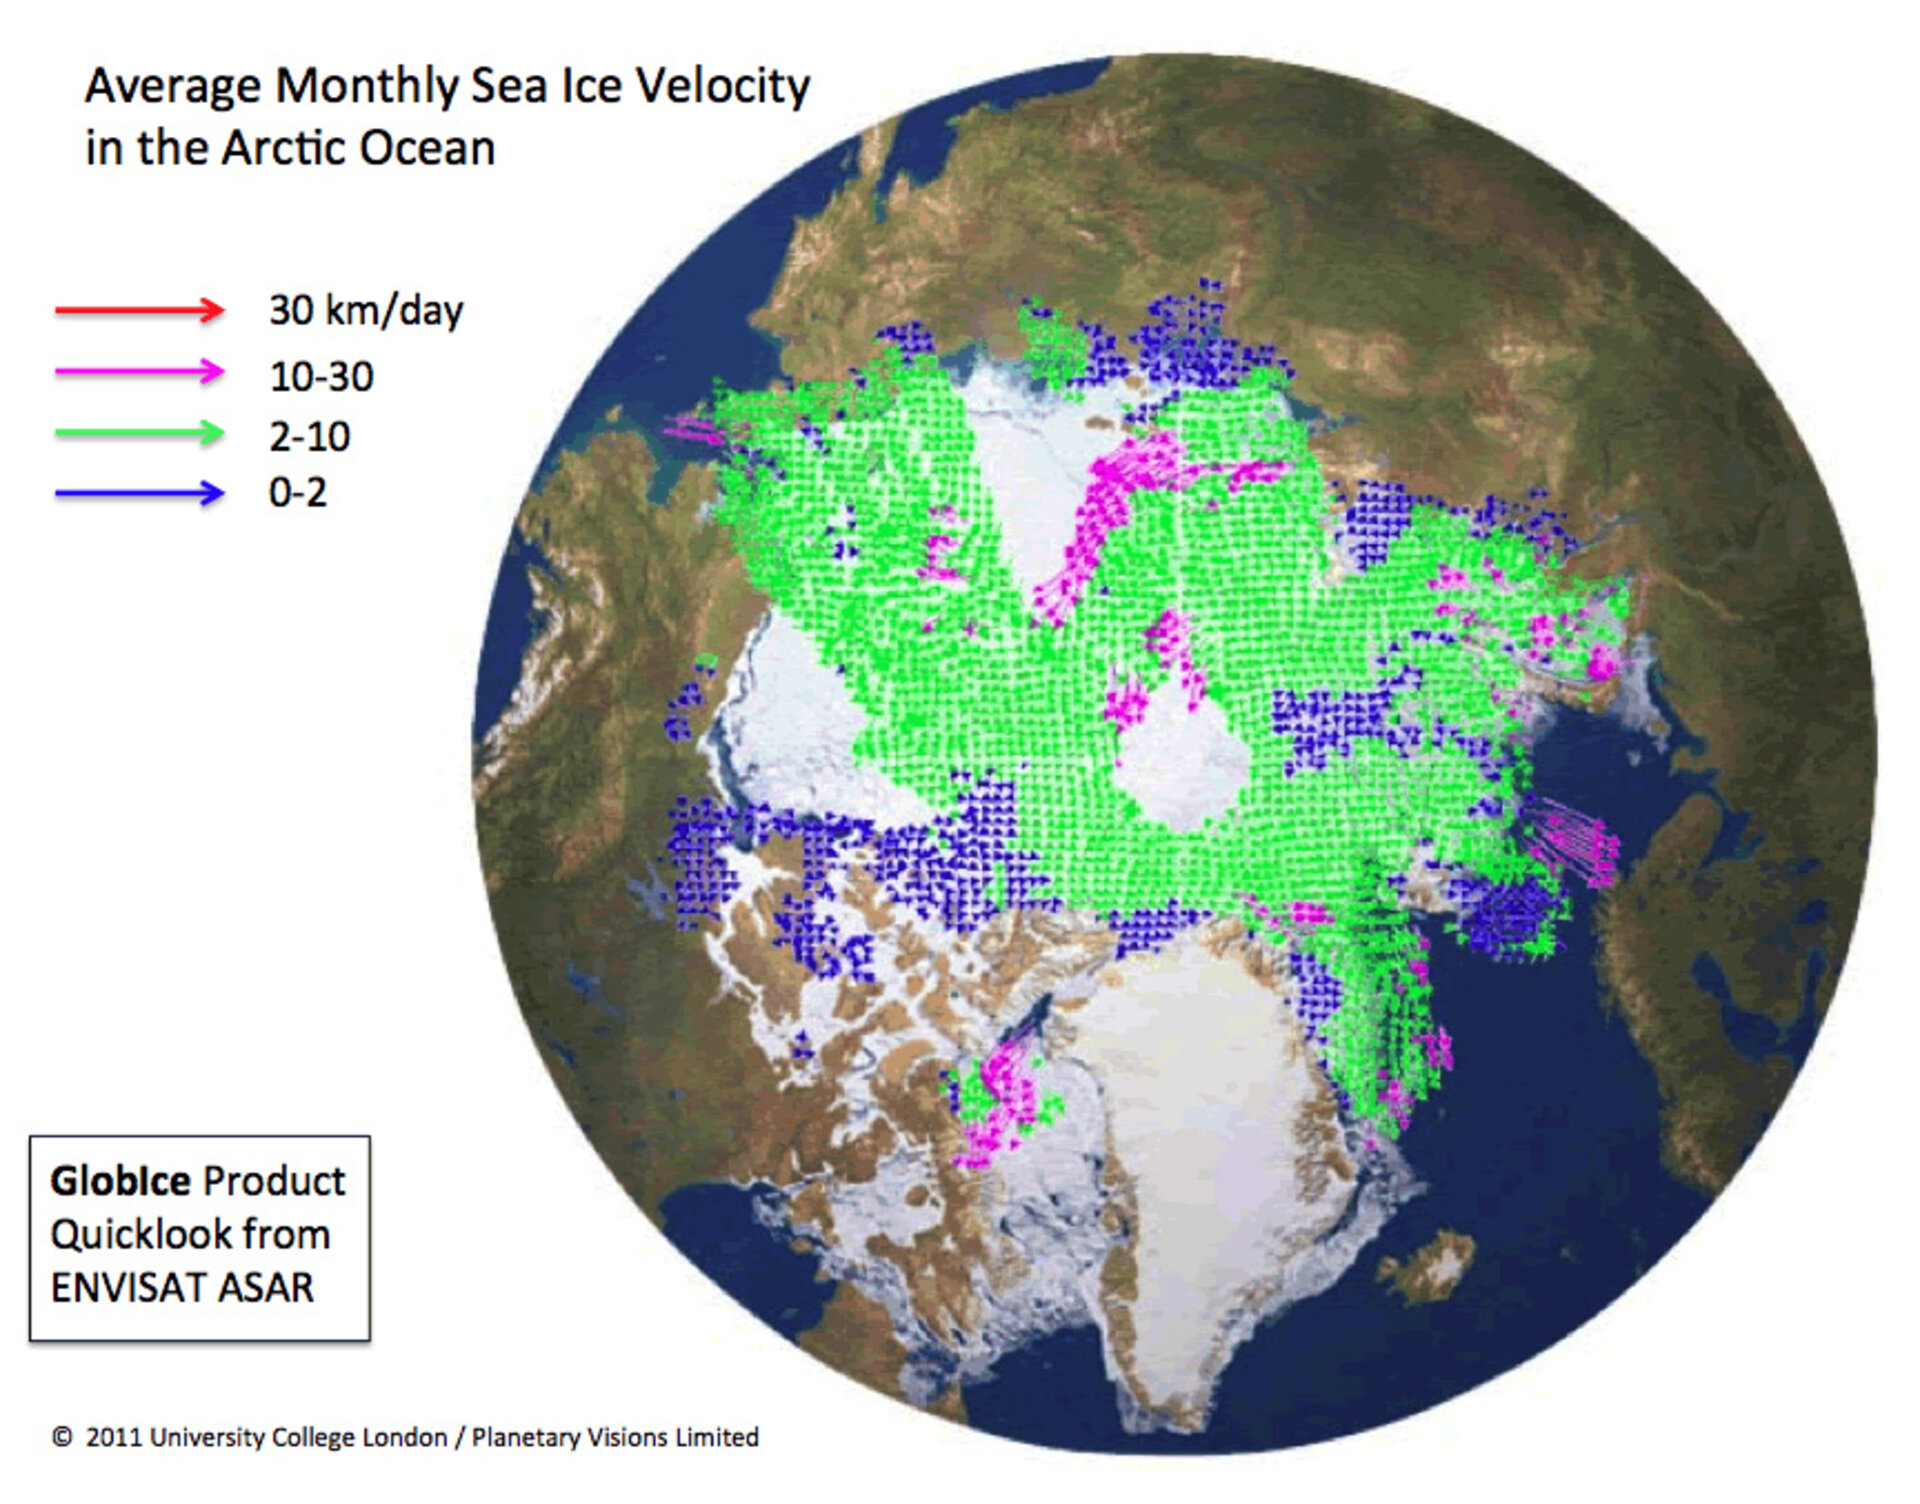
Sample product of average monthly sea ice drift velocity over the Arctic using data from ESA’s Envisat mission. The arrows indicate the direction that floating sea ice drifts, while the colours of the arrows represent the different speeds. Average velocity products are now available for 3-day and monthly periods at grid resolutions of 5 km and 50 km.