Satellites improve air quality monitoring in South Africa
Economic development often means an increase of harmful gases into the atmosphere. ESA’s GlobEmission project uses satellite data to monitor atmospheric pollution from emissions.
South Africa’s economy is rapidly growing. From 2002 to 2012, its gross domestic product grew by about 270 billion US dollars. Unfortunately, a strong economy often leads to high levels of air pollutants – which can influence regional air quality and can have an impact on global climate change.
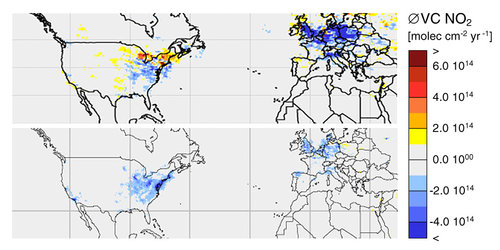
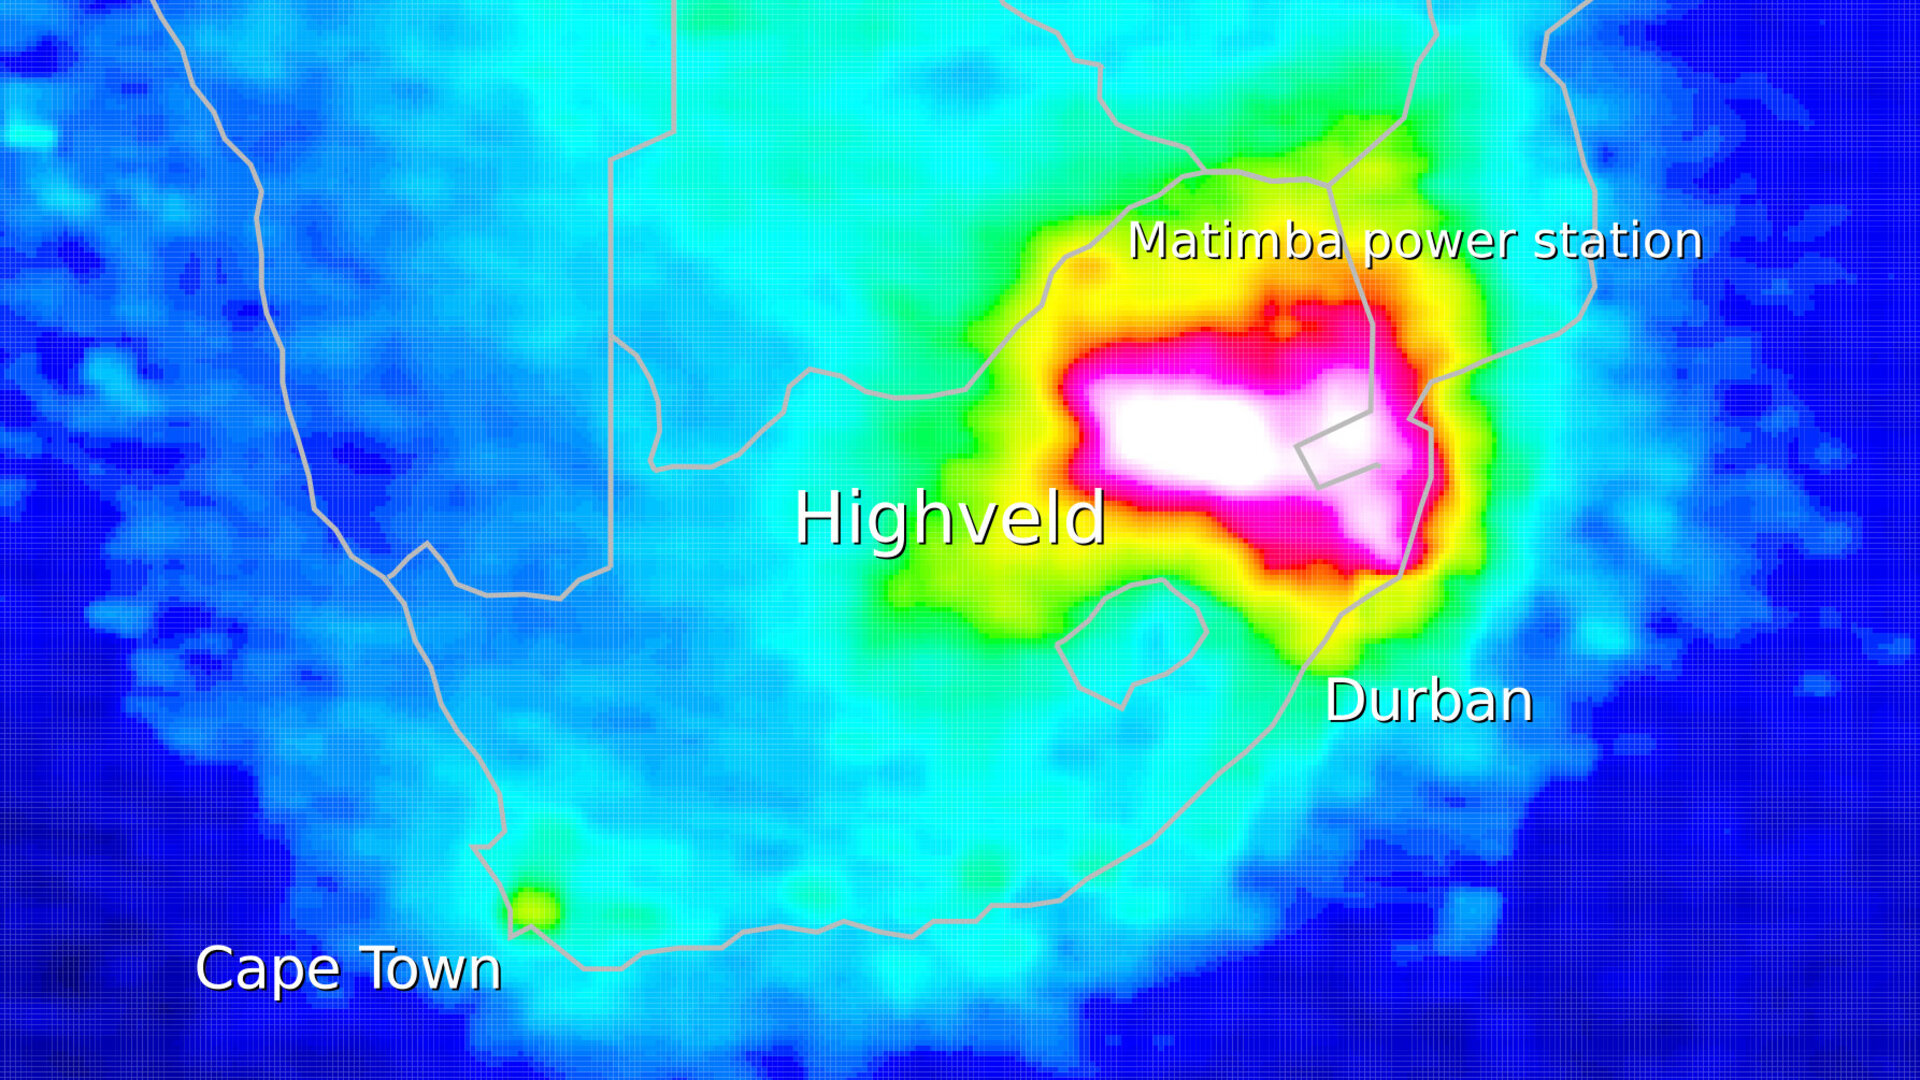
Over the industrialised Highveld region, satellites show concentrations of the air pollutant nitrogen dioxide comparable to those observed in Europe, eastern North America and south-east Asia. With such high levels of air pollution, it is important to monitor the emissions that cause them.
Emission inventories are used to describe the location and magnitude of emissions from various origins, such as traffic, forest fires or industry. These inventories are then used for scientific atmospheric models, as well as by policy makers to evaluate the effectiveness of air quality improvement initiatives and decide on future strategies.
Emission inventories are usually compiled from large amounts of statistical data, but are limited by the lack of continuity. Furthermore, events such as forest fires or extreme weather are not taken into account. In addition, economic developments – such as recession or the closing of factories – directly affect atmospheric composition but are not accounted for by common emission inventories.
Earth observation satellite observations, however, can provide consistent data on atmospheric composition for improved emissions inventories. For a closer look, ESA began the GlobEmission project to focus on emissions for four specific regions: China, India, Europe and South Africa.
“In GlobEmission, we use state-of-the-art satellite measurements and computer models to calculate the measured air pollutant concentrations back to their origins,” said Dr Ronald van der A, leader of the GlobEmission project.
“The advantages of these emission estimates are their spatial consistency and high temporal resolution. Above all, they are rapidly available because there is no more need to wait for the newest release of statistical data.”
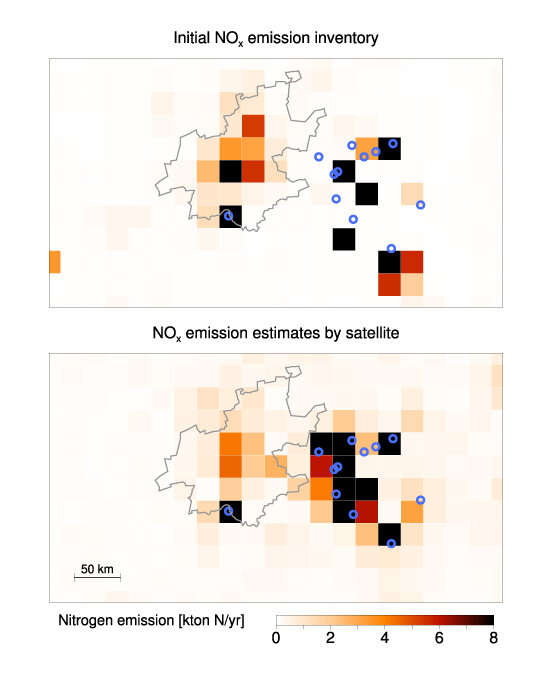
At the Dutch meteorological institute KNMI, Dr Bas Mijling works on improving regional emission estimates using nitrogen dioxide observations from the GOME-2 instrument on Eumetsat’s MetOp satellite and the OMI instrument on NASA’s Aura. He was surprised to see such a large difference between the estimated emissions values for South Africa’s Highveld region and actual values from the satellites.
“The old inventory was especially wrong about the location and strength of emissions by power plants and heavy industry. Using satellite data, however, we can correct their location and update their emission to actual values,” he explained.
A next step in the GlobEmission project is being taken by the Belgian company VITO, who will refine the South African emission values by using statistical information on population density, traffic and land use.
Furthermore, emissions from wildfires, forests and agricultural land use will also be taken into account. All information will be made available on the GlobEmission website.
The Department of Environmental Affairs of South Africa is already planning to use this new emission inventory to improve their emission monitoring programme.
Results of emission inventories derived from satellite observations will be presented to users and potential users in December at ESA’s ESRIN centre in Frascati, Italy. In the same workshop, users will show the use of these data in their daily work.