1. Which colour dominates the image?
2. Compare the image with a map from your atlas or use a map of New Orleans found on the Internet.
Can you locate Lake Pontchartrain, the built-up areas of the city, and the meandering river?
3. Using the Measure tool, measure the distance from the river to the coast of Lake Pontchartrain.
Split the RGB view into the three single channels and examine them separately.
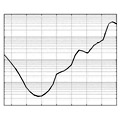
4. Afterwards, generate a detailed explanation of the RGB view’s appearance referring to the table above as well as to the graph shown below.
5. Focus on a part of Lake Pontchartrain at location x,y: 580,750.
6. Describe the appearance of the lake in the three images and measure the pixel values.
7. Compare your observations with the graph below.
8. Why does the water in the NIR image, Band 1, look darker than in the two other images?
You should be able to distinguish between flooded and non-flooded parts of New Orleans.
 | |
Storm surges
|
| • | Introduction (http://www.esa.int/SPECIALS/Eduspace_Disasters_EN/SEM075WX7YG_0.html) |
|
Hurricane Katrina
|
| • | Introduction (http://www.esa.int/SPECIALS/Eduspace_Disasters_EN/SEMVX9WX7YG_0.html) |
|
Exercises
|
| • | Exercise 1: Spiraling Hurricane Katrina from cloud tops to ocean waves (http://www.esa.int/SPECIALS/Eduspace_Disasters_EN/SEM02AWX7YG_0.html) |
|
| • | Exercise 2: Visualising and examining flooded areas in New Orleans caused by Hurricane Katrina (http://www.esa.int/SPECIALS/Eduspace_Disasters_EN/SEMS1BWX7YG_0.html) |
|
Eduspace - Software
|
| • | LEOWorks 3 (http://esamultimedia.esa.int/multimedia/LEOWorks3.exe) |
|
Eduspace - Download
|
| • | Envisat and SPOT data (zip) (http://esamultimedia.esa.int/images/EduSpace/LEOWorksdata.zip) |
|
Related links
|
| • | Hurricane Katrina - NOAA (http://www.katrina.noaa.gov/) |
|
| • | Hurricane Katrina - Wikipedia (http://en.wikipedia.org/wiki/Hurricane_Katrina) |
|
| • | National Hurricane Center - NOAA (http://www.nhc.noaa.gov/) |
|
| • | Storm surge overview - NOAA (http://www.nhc.noaa.gov/ssurge/ssurge_overview.shtml) |
|
| • | Global Monitoring for Environment and Security - ESA (http://www.esa.int/esaLP/LPgmes.html) |
|
| • | International Charter Space and Major Disasters (http://www.disasterscharter.org/) |
|
| • | Tropical weather and hurricanes - Physicalgeography (http://www.physicalgeography.net/fundamentals/7u.html) |
|
Related news
|
| • | Envisat sees whirling Hurricane Katrina from ocean waves to cloud tops (http://www.esa.int/esaCP/SEMB41A5QCE_index_0.html) |
|
Related videos
|
| • | Cyclone Floyd - 9 September 1999
(0.7 Mb) (http://www.esa.int/SPECIALS/Eduspace_Disasters_EN/SEMJ52PK2AG_0.html) |
|
| • | Cyclone Floyd - 13 September 1999
(1.5 Mb) (http://www.esa.int/SPECIALS/Eduspace_Disasters_EN/SEM782PK2AG_0.html) |
|
| • | Cyclone Floyd - 14 September 1999
(1.6 Mb) (http://www.esa.int/SPECIALS/Eduspace_Disasters_EN/SEM892PK2AG_0.html) |
|
| • | Cyclone Floyd - 15-16 September 1999
(3.4 Mb) (http://www.esa.int/SPECIALS/Eduspace_Disasters_EN/SEMF72PK2AG_0.html) |
|