Hurricane Katrina

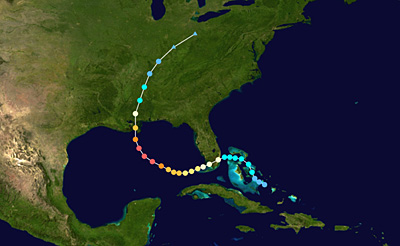 |
Tracking Hurricane Katrina
|
On 25 August 2005, Hurricane Katrina hit the densely populated south-eastern part of the US state of Florida with squalls of 130 kilometres per hour at maximum speed, and caused extensive damage. Fatal floods were generated by the precipitations.
The hurricane then moved along the Gulf of Mexico, where it gained energy, fed by the warm water, and reached category 5 on the Saffir-Simpson Hurricane Scale. On 29 August Katrina hit the southern coast of the USA where it devastated the infrastructures on a coastal strip of about 160 kilometres. When it arrived in New Orleans, Katrina was downgraded to Category 3. Overland the hurricane rapidly lost energy and ceased on 31 August on its northeastern path. New Orleans was consequently hit by a strong storm surge.
How did this happen?
On 25 August, a low-pressure eddy above the Bahamas in the Atlantic Ocean developed into Hurricane Katrina. Like in every low-pressure area in the northern hemisphere, the air current was circulating anti-clockwise.
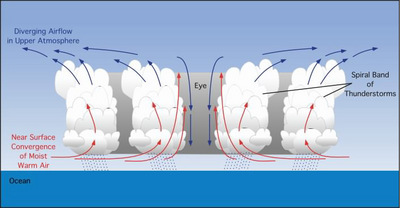 |
Graphical model showing a vertical cross-section of the air circulation, clouds, and precipitation associated with a hurricane
|
In order for tropical hurricanes to form, the sea surface temperature must be at least 27 degrees Celsius. Water evaporates as a consequence of solar radiation, ascends as moist air, and shapes clouds as the water vapour condenses and releases energy.
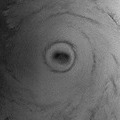 | |
Close-up of the ASAR Wide Swath Mode image of Hurricane Katrina's eye
| |
Because of the Coriolis force an eddy is formed, which subsequently drags streaming air up in a spiral. It revolves around the ‘eye’ of the hurricane, where there is virtually no wind because of extremely low air pressure at the surface of the sea. Humid, maritime air streams towards the ’eye’ and increasingly ascends there. It drags cooler air which is subsequently warmed. In this way a stable system is generated, which can produce extremely high wind speeds.
The official hurricane season lasts from June to November. Hurricanes can pose immense threats to the population as well as to the infrastructures. This is due to intense precipitations and flooding, as well as high wind speeds.
This case study will focus on the use of remote sensing in monitoring hurricanes and the damage they cause, using both optical and radar images acquired by European satellites.
Last update: 13 January 2014
| |
Storm surges
| | • | Introduction (http://www.esa.int/SPECIALS/Eduspace_Disasters_EN/SEM075WX7YG_0.html) | |
Hurricane Katrina
|
Exercises
| | • | Exercise 1: Spiraling Hurricane Katrina from cloud tops to ocean waves (http://www.esa.int/SPECIALS/Eduspace_Disasters_EN/SEM02AWX7YG_0.html) | | | • | Exercise 2: Visualising and examining flooded areas in New Orleans caused by Hurricane Katrina (http://www.esa.int/SPECIALS/Eduspace_Disasters_EN/SEMS1BWX7YG_0.html) | |
Related links
| | • | Hurricane Katrina - NOAA (http://www.katrina.noaa.gov/) | | | • | Hurricane Katrina - Wikipedia (http://en.wikipedia.org/wiki/Hurricane_Katrina) | | | • | National Hurricane Center - NOAA (http://www.nhc.noaa.gov/) | | | • | Storm surge overview - NOAA (http://www.nhc.noaa.gov/ssurge/ssurge_overview.shtml) | | | • | Global Monitoring for Environment and Security - ESA (http://www.esa.int/esaLP/LPgmes.html) | | | • | International Charter Space and Major Disasters (http://www.disasterscharter.org/) | | | • | Tropical weather and hurricanes - Physicalgeography (http://www.physicalgeography.net/fundamentals/7u.html) | |
Related news
| | • | Envisat sees whirling Hurricane Katrina from ocean waves to cloud tops (http://www.esa.int/esaCP/SEMB41A5QCE_index_0.html) | |
Related videos
| | • | Cyclone Floyd - 9 September 1999
(0.7 Mb) (http://www.esa.int/SPECIALS/Eduspace_Disasters_EN/SEMJ52PK2AG_0.html) | | | • | Cyclone Floyd - 13 September 1999
(1.5 Mb) (http://www.esa.int/SPECIALS/Eduspace_Disasters_EN/SEM782PK2AG_0.html) | | | • | Cyclone Floyd - 14 September 1999
(1.6 Mb) (http://www.esa.int/SPECIALS/Eduspace_Disasters_EN/SEM892PK2AG_0.html) | | | • | Cyclone Floyd - 15-16 September 1999
(3.4 Mb) (http://www.esa.int/SPECIALS/Eduspace_Disasters_EN/SEMF72PK2AG_0.html) | |
|