
|
Esercizio 3: Rilevamento lava - immagini e mappe della crisi - 3a parte Cambiamenti dal 1999 al 2003  A visual change detection is performed between the Landsat images of 1999 and those of 2003. A region in the south-west and north-east of the summit has been used as an example. 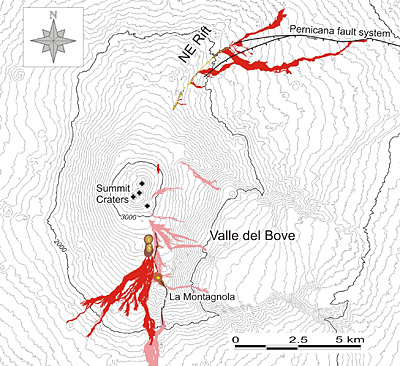 The map of the lava flows emitted during the 2002-2003 eruption (shown in red), based in part on post-eruption surveys of the lava fields (much of these carried out by staff of the Catania section of the Istituto Nazionale di Geofisica e Vulcanologia). Pyroclastic cones are shown in dark brown color, and eruptive vents in yellow. Lava flowing out during the July-August 2001 eruption are shown in pink for comparison. |