|
Spectral signatures
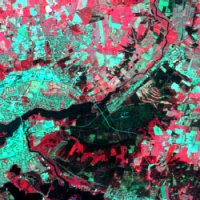
This makes it possible to distinguish vegetation areas from bare ground. The difference in reflection in channels 3 and 4 is great for vegetation areas and insignificant for bare ground.
The reflection from bare ground increases slightly from the visible to the infrared range of the spectrum. There are great differences between different types of soil, dry and humid land. Different mineral compositions of the surface are also reflected in the spectral signature. In the illustration only an average curve for bare ground (soil) is shown. Generally, water only reflects in the visible light range. As water has almost no reflection in the near infrared range it is very distinct from other surfaces. Water surfaces will therefore be clearly delimited as dark areas (low pixel values) in images recorded in the near infrared range.
The spectral signature for green plants is very characteristic. The chlorophyll in a growing plant absorbs visible and especially red light to be used in photosynthesis, whereas near infrared light is reflected very effectively as it is of no use to the plant (see illustration 'Graphs of spectral signatures of water, soil, and vegetation'). In this way the plants avoid unnecessary heating and loss of juice through evaporation. Reflection from vegetation in the near infrared and in the visual ranges of the spectrum therefore varies considerably. The degree of difference between the two reveals how large a part of the area is covered with growing green
leaves. This is called the leaf area index. Last update: 26 November 2009
| ||||||||||||||||||||||||||||||||||||||||