|
Kathmandu Valley with optical images - General overview - Continued
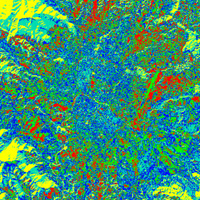
A relatively simple type of classification is 'Unsupervised Classification'. All pixels in an image are grouped into a specified number of classes based on the similarity of their greyscale values. In order to compare our hand-drawn classification with the unsupervised classification, we should use the same number of classes.
Open the LEOWorks programme. Choose the Kathmandu folder and select the images:
Kathmandu_Landsat_2001_Band_1.tif, Choose Multivariate Analysis>Unsupervised Classification and select all images. Type 5 for Nr. of Classes and 10 for Nr. of Iterations. An iteration is the repetition of a sequence of computer instructions a specified number of times or until a condition is met. Save the new image as Kathmandu_2001_unsupervised in TIFF format in the Kathmandu folder.
Compare the unsupervised classification with your hand-drawn one.
Which image features are very easily identifiable?
Why does the built-up area of Kathmandu not stand out from the surrounding grass and crop land?
To answer this question, look at the two photographs showing roads and buildings in the city of Patanin of the Kathmandu Valley. Let's try to improve the unsupervised classification of Kathmandu in order to differentiate the built-up area.
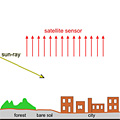
One image that could help is the 'thermal' image, Kathmandu_Landsat_2001_Band_61.tif. Open the image in LEOWorks and enhance the contrast with Enhance>Interactive Stretching.
Another image would be a NDVI. However, since we are using the 2001 data for classification it is unnecessary to produce a winter-NDVI, due to the absence of vegetation. Follow the steps and produce a new image.
Open the LEOWorks programme and the images There is, of course, a reason for choosing Landsat band 1 and band 4 for the unsupervised classification. It is explained in the case study 'Kathmandu Now and Then - Urban Detection with Optical Images'.
Choose Multivariate Analysis>Unsupervised Classification and select all images. Type 5 for Nr. of Classes and 10
for Nr. of Iterations. An iteration is the repetition of a sequence of computer instructions a specified number of
times or until a condition is met. Save the new image as Kathmandu_2001_unsupervised in TIFF format in the
Kathmandu folder.
Choose Image>Add Legend and check the combination of colours and class names. The forest, shrub, grass and crop land are quite clearly visible. Remember - this is only an unsupervised classification without any additional manual input.
Can you explain why the forest in the mountainous areas is split into two colours/classes? To answer this, study the 2001 thermal image.
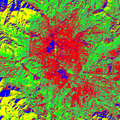
Which geographical feature has the same colour as the shadowed mountain forest? Explain why. Which additional classes are now clearly identifiable when comparing the two unsupervised classifications? The aim of this part of the case study is to produce a basic but correct classification. We have done one manually and tried to do another one digitally. However, without putting any effort into analysing the satellite images, the result is not as good as it could be. So let's put some more effort into the digital classification and try a supervised classification of Kathmandu and see what happens. Remember - we want to overlay our hand-drawn map with a digital classification. And of course, we want the image to be fairly similar. The 'maximum likelihood classification' is a supervised classification method. It is based on sophisticated statistical methods. It uses training fields representing the different land use classes. Each land use class has its own specific spectral fingerprint. At least one training field has to be defined for each type of land cover to be classified. LEOWorks evaluates all these training fields and allocates each image element (pixel) to one of the given land use classes. Meanwhile, you are now an expert of Kathmandu, and it should not be a problem to select training fields. The more training fields you are able to select for a class and the more accurately you do it, the more accurate the result will be.
We are going to use the whole spectrum of Landsat bands. To do that, open the images
and to select the training fields Select (activate) the image Kathmandu_Landsat_2001_Band_453.tif and choose Multivariate Analysis>Supervised Classification>Select Training Fields. Select Draw Polygon from the toolbar. Start with the forest. Draw a polygon within the North-Western forest and name the class 'Forest and shrub'. Draw another polygon within the South-Western forest and name the class 'Forest and shrub' again. Draw some more polygons within forested land and name the class. Do the same with all other classes. High Level Classes
Set the Threshold Value to '5%'. The colours in the classification will have to be changed. Choose Image>Add Legend and check the combination of colours and class names. Choose Edit LookUp Table and select the forest class colour. Change the colour to a dark green. Change all the other colours, too. Save the classification as 'Kathmandu_2001_maximlike.tif' in your Kathmandu folder.
Why are there some unclassified (white) areas in the supervised classification of Kathmandu?
Which geographical situations are unclassified? Into how many classes would you separate the white area? Which colours would you give those classes? What happened to the 'River' class? Why is that class still unclassified? Last update: 16 April 2013
| ||||||||||||||||||||||||||||||||||||||||||||||||||||||||||||||||||||||||||||||||||||||||