|
Inspection of the images
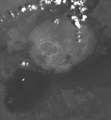
Band1_00 Band2_00 Band3_00 Band4_00 Band5_00 Band7_00 1) Open Band1_00 in LEOWorks.
The images are extracted from a Landsat 7 scene.
2) The image looks grey without contrast. Therefore choose Enhance/Interactive Stretching to improve the contrast of the image. Move the blue and pink lines so that they encompass the area showing the distribution of the pixel values in the histogram.
Try to find the following landscape elements:
3) Choose Image/Measure tool. Select Units/Meters in the Measure tool window.
Click on the start point and the end point and read the length of the segment. Right click to end measurements.
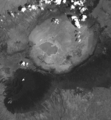
Find the diameter of the crater.
Draw a profile along the red line.Find the diameter of the lake in the crater.
4) Draw a North South profile. The height above sea level for the crater lake is 1700 metres, whereas it is of 2300 metres for the crater rim. Using this information, as well as the satellite image here, draw a line from North to South on rough sketch paper. You will use this profile later.
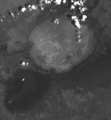
5) Open Band2_00 and Band3_00 in LEOWorks and enhance these images using the Interactive stretching described above. Compare the images. They look different because they are from different parts of the spectrum:
Band1_00 blue light
To make a colour image, select Image/Combine from.../(Red Green Blue). Select a band combination as shown above and click OK. Save the image with the name NGO321_00. Inspect the image. Remember that the colours are the real colours. This means that vegetation shows up as green.
Briefly describe the distribution of vegetation.
Last update: 4 July 2013
| ||||||||||||||||||||||||||||||||||||||||||||||||||||||||||||||||