|
Exercise 2 : NDVI Animation
Before continuing, find out more about vegetation indices, NDVI, and SPOT Vegetation imagery in the background articles (see right). Download the Year2000.zip file from the menu on the right.
We are going to work with one image at a time, because we need to convert these images to “image with LUT” in order to be able to apply a Look Up Table (LUT) that will allow us to easily observe the NDVI changes. The next step will consist in saving the image created as a BMP, PNG, JPG or TIFF. Once the twelve images are saved, we will create the animation.
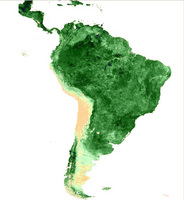
1. Observe and describe the variation in the NDVI value during the year 2000. 2. In what months is the NDVI at its maximum in the Amazon basin? Can you explain why? 3. Observe the December image for the northeastern part of Brasil along the Atlantic coast and inland. Can you explain the vegetation pattern? 4. Can you explain the variation in vegetation along the Pacific coast? 5. Compare the information on climate as described in the maps in a normal school atlas with the NDVI images. How are the yearly changes of the location of the Inter-Tropical Convergence Zone (ITCZ) reflected in the NDVI images? Last update: 16 April 2013
| ||||||||||||||||||||||||||||||||||||||||||||||||||||