Download and print the
climate diagrammes (PDF)
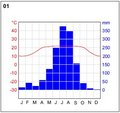
Climate diagrammes describe the predominant climate at a well-defined position. They show the average precipitation and temperature during the year.
It is thus possible to allocate the diagrammes to the climate zones and the data acquisition location.
Print the PDF file providing the climate diagrammes and fill in the temperature line and the precipitation bars (or use the ready-made diagrammes found below).
After this, assign the diagrammes to each of the given data acquisition locations.
Download and print the temperature diagrammes (PDF)
 | |
Himalaya
|
| • | Introduction (http://www.esa.int/SPECIALS/Eduspace_Weather_EN/SEMLWXJTYRF_0.html) |
|
| • | Background (http://www.esa.int/SPECIALS/Eduspace_Weather_EN/SEM7XXJTYRF_0.html) |
|
Exercises
|
| • | Introduction (http://www.esa.int/SPECIALS/Eduspace_Weather_EN/SEMZYXJTYRF_0.html) |
|
| • | Manual exercises (http://www.esa.int/SPECIALS/Eduspace_Weather_EN/SEM17YJTYRF_0.html) |
|
| • | Study of water vapour in the atmosphere (http://www.esa.int/SPECIALS/Eduspace_Weather_EN/SEMY9ZJTYRF_0.html) |
|
| • | The summer monsoon and its floods (http://www.esa.int/SPECIALS/Eduspace_Weather_EN/SEM9EZJTYRF_0.html) |
|
Links
|
| • | Meteosat images (http://www.eumetsat.int) |
|
| • | Weather broadcast worldwide (http://weather.edition.cnn.com/weather/intl/forecast.jsp) |
|
| • | Climate system (http://www.espere.net/index.html) |
|
| • | CARE (http://www.careinternational.org.uk/) |
|
| • | DLR - Basemapping
of Dhaka (http://www.zki.caf.dlr.de/applications/2004/bangladesh/bangladesh_flood_2004_en.html) |
|
Eduspace - Software
|
| • | LEOWorks 3 (http://esamultimedia.esa.int/multimedia/LEOWorks3.exe) |
|
| • | ArcExplorer (http://esamultimedia.esa.int/multimedia/eduspace/ae2setup.zip) |
|
Eduspace - Download
|
| • | Climate zones (PDF) (http://esamultimedia.esa.int/docs/eduspace/climatezones.pdf) |
|
| • | Climate diagrams (PDF) (http://esamultimedia.esa.int/docs/eduspace/Diagramm.pdf) |
|
| • | Temperature and precipitation diagrams (PDF) (http://esamultimedia.esa.int/docs/eduspace/himalaya_climate_temperature.pdf) |
|
| • | Ready-made diagrams (PDF) (http://esamultimedia.esa.int/docs/eduspace/Diagramm_fill.pdf) |
|
| • | Himalayas water vapour images (ZIP) (http://esamultimedia.esa.int/docs/eduspace/MERIS_WV_2003.zip) |
|
| • | SPOT XS images of Bangladesh (ZIP) (http://esamultimedia.esa.int/docs/eduspace/flood88.zip) |
|
| • | Landsat images of Bangladesh (ZIP) (http://esamultimedia.esa.int/docs/eduspace/ganges1989_2000.zip) |
|
| • | Shape files for Bangladesh (ZIP) (http://esamultimedia.esa.int/docs/eduspace/shapes_bangladesh.zip) |
|
| • | Map of climate zones (http://www.esa.int/images/climatemap,0.jpg) |
|