New ice thickness map of the Arctic unveiled (UK)
The first map of sea-ice thickness from ESA’s CryoSat mission was revealed today at the Paris Air and Space Show. This new information is set to change our understanding of the complex relationship between ice and climate.
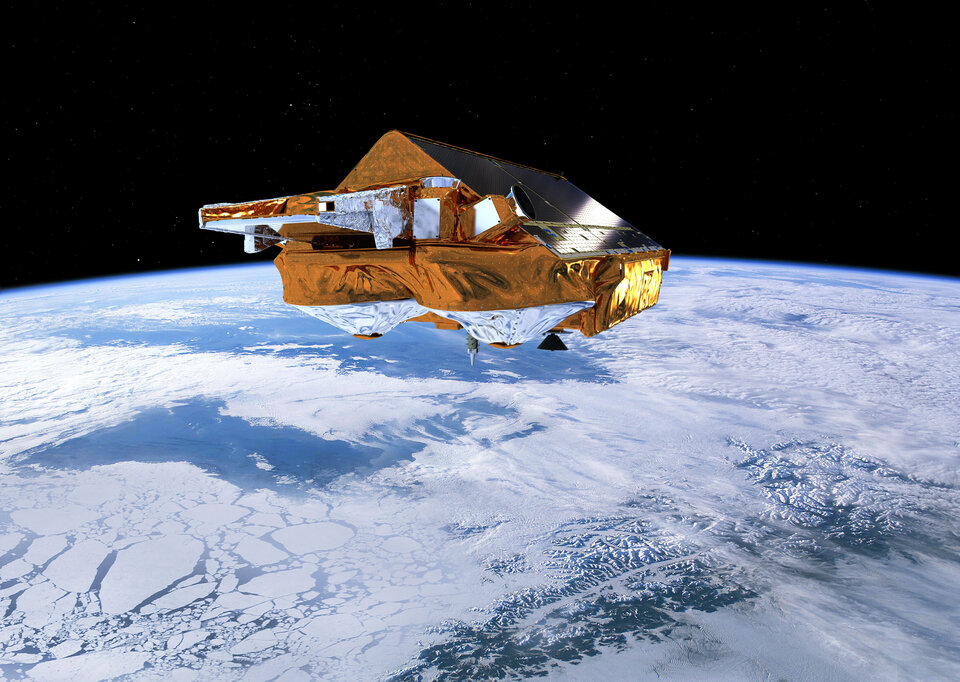
From an altitude of just over 700 km and reaching unprecedented latitudes of 88º, CryoSat has spent the last seven months delivering precise measurements to study changes in the thickness of Earth’s ice.
Satellites have already shown that the extent of sea ice in the Arctic is diminishing. In fact, spring 2011 is the third lowest extent recorded by satellite.
However, to understand fully how climate change is affecting the fragile polar regions, there is a need to determine exactly how the thickness of the ice is changing.
To answer this question, a group of scientists together with Prof. Duncan Wingham from University College London proposed the CryoSat mission to ESA in 1998. The loss of the original CryoSat satellite in 2005 as a result of a launch failure has unfortunately made this a longer than normal wait.
Nevertheless, the launch of the replacement satellite in April 2010 has resulted in these first maps of ice thickness. They clearly demonstrate that CryoSat is a mission of excellence and will greatly advance polar science.
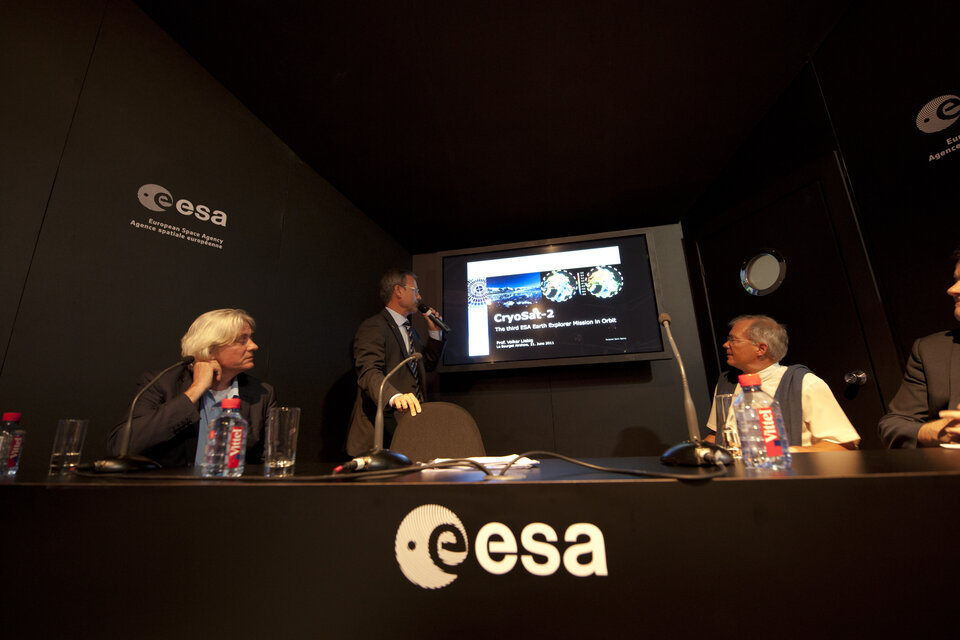
The results were presented at the Le Bourget air and space show by Volker Liebig, ESA's Director of Earth Observation Programmes, Duncan Wingham and René Forsberg from the National Space Institute at the Technical University of Denmark.
Prof. Wingham said, “A new mission is always risky. There's quite a long wait and then everyone gets to see if it really can deliver.
“What's really nice about these results is that they show not only that the hardware is really excellent – which we already knew – but that it can deliver the geophysical information we need too.
“It's a credit to the teams at ESA and UCL who have worked really hard and I'm very happy with these new results.”
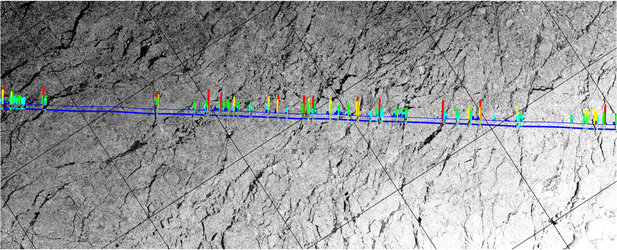
CryoSat measures the height of the sea ice above the water line, known as the freeboard, to calculate the thickness. The measurements used to generate this first map of the Arctic were from January and February 2011, as the ice approaches its annual maximum.
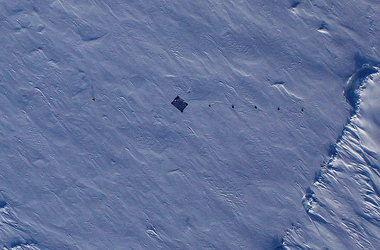
The data are exceptionally detailed and considerably better than the mission’s specification. They even show lineations in the central Arctic that reflect the ice’s response to wind stress.
Prof. Liebig said, “This major result comes just one year after launch. It is another important step towards achieving one of the primary objectives of the mission; namely, to determine how much the sea ice in the Arctic is thinning in response to a changing climate.”
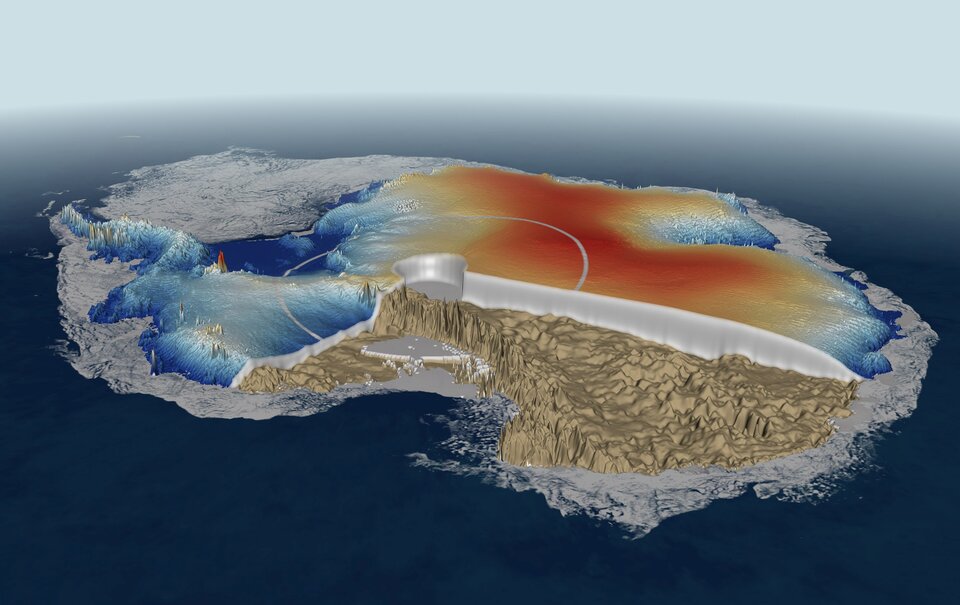
A new map of Antarctica has also been created showing the height of the ice sheet. This is more preliminary because more data are needed here to see what CryoSat can do.
Even so, the extra coverage CryoSat offers near the poles can be demonstrated: parts of Antarctica can now be seen for the first time from space.
In addition, detail of edges of the ice sheet where it meets the ocean can now closely monitored thanks to CryoSat’s sophisticated radar techniques. This is important because this is where changes are occuring.
“It is very satisfying to see these exciting results,” said ESA’s Richard Francis, who was the CryoSat-2 Project Manager during its development.
“It has taken about ten years to convert the initial proposal into a flying mission: ten years of hard work and dedication from a core team of less than a hundred people, ably assisted with crucial expertise from a few hundred more.”
ESA’s CryoSat Mission Manager, Tommaso Parrinello, added, “These first results are very exciting as we begin to see the mission’s potential realised.
“The coming months will be dedicated to completing the picture to gain better insight into how polar ice is changing.”