Ship-sinking monster waves revealed by ESA satellites
Once dismissed as a nautical myth, freakish ocean waves that rise as tall as ten-storey apartment blocks have been accepted as a leading cause of large ship sinkings. Results from ESA's ERS satellites helped establish the widespread existence of these 'rogue' waves and are now being used to study their origins.
Severe weather has sunk more than 200 supertankers and container ships exceeding 200 metres in length during the last two decades. Rogue waves are believed to be the major cause in many such cases.
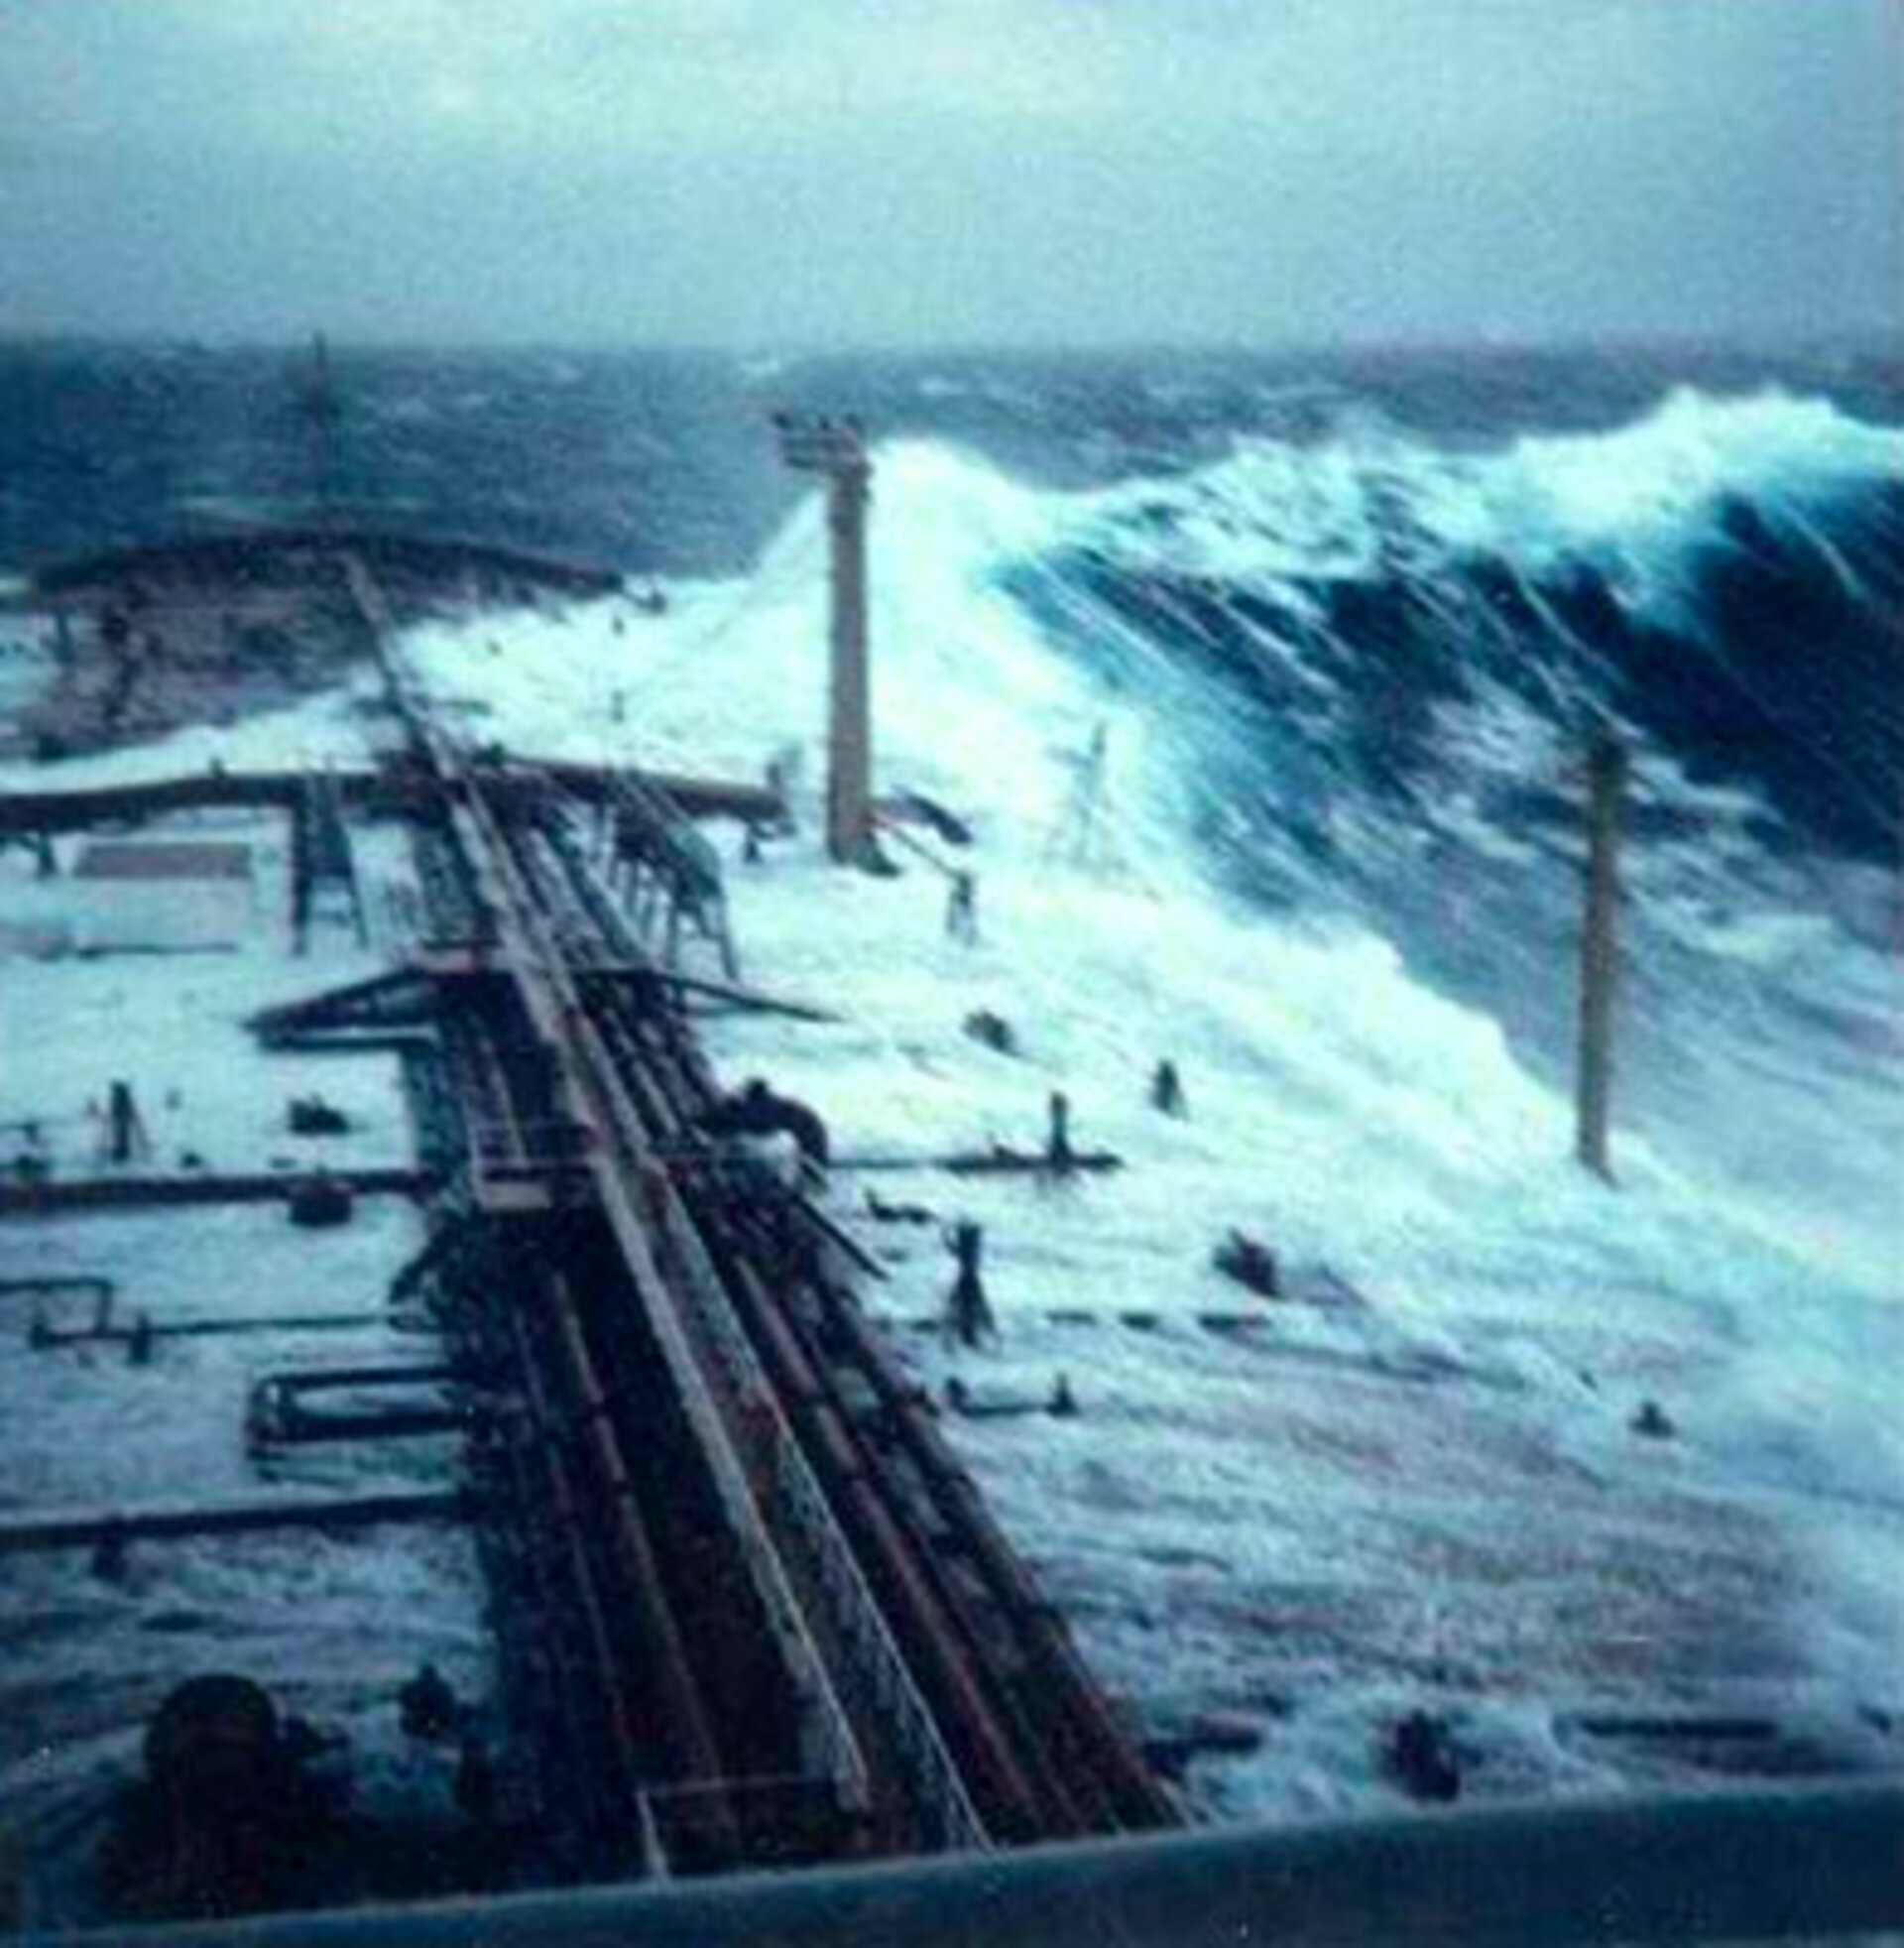
Mariners who survived similar encounters have had remarkable stories to tell. In February 1995 the cruiser liner Queen Elizabeth II met a 29-metre high rogue wave during a hurricane in the North Atlantic that Captain Ronald Warwick described as "a great wall of water… it looked as if we were going into the White Cliffs of Dover."
And within the week between February and March 2001 two hardened tourist cruisers – the Bremen and the Caledonian Star – had their bridge windows smashed by 30-metre rogue waves in the South Atlantic, the former ship left drifting without navigation or propulsion for a period of two hours.

"The incidents occurred less than a thousand kilometres apart from each other," said Wolfgang Rosenthal - Senior Scientist with the GKSS Forschungszentrum GmbH research centre, located in Geesthacht in Germany - who has studied rogue waves for years. "All the electronics were switched off on the Bremen as they drifted parallel to the waves, and until they were turned on again the crew were thinking it could have been their last day alive.
"The same phenomenon could have sunk many less lucky vessels: two large ships sink every week on average, but the cause is never studied to the same detail as an air crash. It simply gets put down to 'bad weather'."
Offshore platforms have also been struck: on 1 January 1995 the Draupner oil rig in the North Sea was hit by a wave whose height was measured by an onboard laser device at 26 metres, with the highest waves around it reaching 12 metres.

Objective radar evidence from this and other platforms – radar data from the North Sea's Goma oilfield recorded 466 rogue wave encounters in 12 years - helped convert previously sceptical scientists, whose statistics showed such large deviations from the surrounding sea state should occur only once every 10000 years.
The fact that rogue waves actually take place relatively frequently had major safety and economic implications, since current ships and offshore platforms are built to withstand maximum wave heights of only 15 metres.
In December 2000 the European Union initiated a scientific project called MaxWave to confirm the widespread occurrence of rogue waves, model how they occur and consider their implications for ship and offshore structure design criteria. And as part of MaxWave, data from ESA's ERS radar satellites were first used to carry out a global rogue wave census.

"Without aerial coverage from radar sensors we had no chance of finding anything," added Rosenthal, who headed the three-year MaxWave project. "All we had to go on was radar data collected from oil platforms. So we were interested in using ERS from the start."
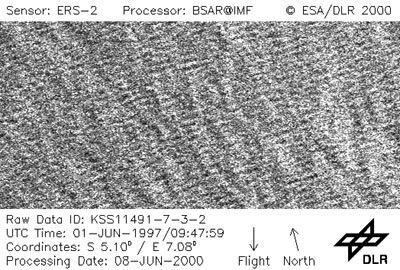
ESA's twin spacecraft ERS-1 and 2 – launched in July 1991 and April 1995 respectively – both have a Synthetic Aperture Radar (SAR) as their main instrument.
The SAR works in several different modes; while over the ocean it works in wave mode, acquiring 10 by 5 km 'imagettes' of the sea surface every 200 km.
These small imagettes are then mathematically transformed into averaged-out breakdowns of wave energy and direction, called ocean-wave spectra. ESA makes these spectra publicly available; they are useful for weather centres to improve the accuracy of their sea forecast models.
"The raw imagettes are not made available, but with their resolution of ten metres we believed they contained a wealth of useful information by themselves," said Rosenthal. "Ocean wave spectra provide mean sea state data but imagettes depict the individual wave heights including the extremes we were interested in.
"ESA provided us with three weeks' worth of data – around 30,000 separate imagettes – selected around the time that the Bremen and Caledonian Star were struck. The images were processed and automatically searched for extreme waves at the German Aerospace Centre (DLR)."
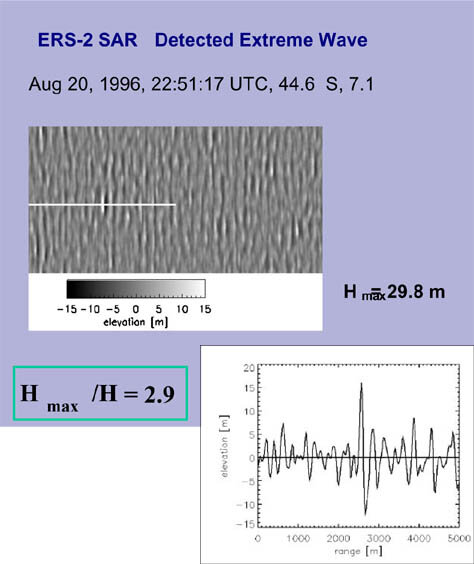
Despite the relatively brief length of time the data covered, the MaxWave team identified more than ten individual giant waves around the globe above 25 metres in height.
"Having proved they existed, in higher numbers than anyone expected, the next step is to analyse if they can be forecasted," Rosenthal added. "MaxWave formally concluded at the end of last year although two lines of work are carrying on from it – one is to improve ship design by learning how ships are sunk, and the other is to examine more satellite data with a view to analysing if forecasting is possible."
A new research project called WaveAtlas will use two years worth of ERS imagettes to create a worldwide atlas of rogue wave events and carry out statistical analyses. The Principal Investigator is Susanne Lehner, Associate Professor in the Division of Applied Marine Physics at the University of Miami, who also worked on MaxWave while at DLR, with Rosental a co-investigator on the project.
"Looking through the imagettes ends up feeling like flying, because you can follow the sea state along the track of the satellite," Lehner said. "Other features like ice floes, oil slicks and ships are also visible on them, and so there's interest in using them for additional fields of study.
"Only radar satellites can provide the truly global data sampling needed for statistical analysis of the oceans, because they can see through clouds and darkness, unlike their optical counterparts. In stormy weather, radar images are thus the only relevant information available."
So far some patterns have already been found. Rogue waves are often associated with sites where ordinary waves encounter ocean currents and eddies. The strength of the current concentrates the wave energy, forming larger waves – Lehner compares it to an optical lens, concentrating energy in a small area.
This is especially true in the case of the notoriously dangerous Agulhas current off the east coast of South Africa, but rogue wave associations are also found with other currents such as the Gulf Stream in the North Atlantic, interacting with waves coming down from the Labrador Sea.
However the data show rogue waves also occur well away from currents, often occurring in the vicinity of weather fronts and lows. Sustained winds from long-lived storms exceeding 12 hours may enlarge waves moving at an optimum speed in sync with the wind – too quickly and they'd move ahead of the storm and dissipate, too slowly and they would fall behind.
"We know some of the reasons for the rogue waves, but we do not know them all," Rosenthal concluded. The WaveAtlas project is scheduled to continue until the first quarter of 2005.