Image of the day: Carbon dioxide on the rise
The SCIAMACHY sensor on ESA’s Envisat satellite has provided scientists with invaluable data on our planet, allowing them to map global air pollution and the distribution of greenhouse gases.
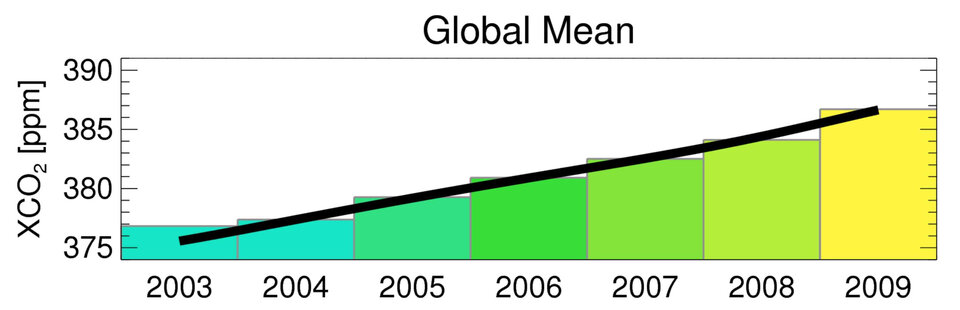
Using SCIAMACHY data from 2003-2009, scientists have detected an increase in atmospheric carbon dioxide (CO2) – one of the most important greenhouse gases that contributes to global warming – by about 2 parts per million (ppm).
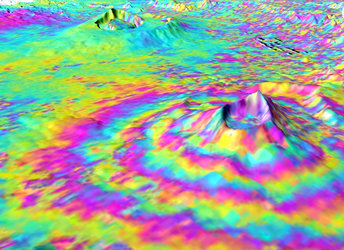
The animation shows the column-averaged mixing ratio of CO2, denoted XCO2, in ppm; 380 ppm means that one million air molecules contain 380 CO2 molecules.
The year-to-year increase is shown more clearly in the Global Mean image, where yearly mean values are displayed.
Dr Michael Buchwitz and Oliver Schneising from the Institute of Environmental Physics at the University of Bremen in Germany processed the SCIAMACHY data using a retrieval algorithm developed at the University of Bremen. Mr Schneising is carrying out this work as part of ESA’s Support to Science Element (STSE) post-doc student network.
CO2 occurs naturally as well as being created through human activities, such as the burning of fossil fuels (oil, coal and gas). According to the scientists, the increase is mainly a result of fossil fuel burning.
Significant gaps remain in the knowledge of CO2 sources, such as fires, volcanic activity and the respiration of living organisms, and its natural sinks, such as the land and ocean.
A good understanding of the sources and sinks of this important greenhouse gas is required for reliable climate prediction. The spatial pattern of the CO2 distribution in these individual maps contains information on its sources and sinks.
"The interpretation of the pattern is not trivial as the atmospheric lifetime of CO2 is very long (many years)," Buchwitz said. "The interpretation is further complicated by the sparse sampling of the SCIAMACHY data which results from the strict filtering applied to eliminate, for example, cloud contaminated observations."
The lower CO2 values at mid-to-high northern latitudes are weighted towards summer, where atmospheric CO2 is low due to uptake by the growing vegetation.
The analysis of this new CO2 data set is ongoing.